MBA Chart of the Week Dec. 2, 2022: GSE Conforming Loan Limits
Last week, the Federal Housing Finance Agency announced conforming loan limits for mortgages eligible to be acquired by Fannie Mae and Freddie Mac in 2023. The 2023 loan limit for one-unit properties for most of the country will be $726,200, an increase of $79,000 from $647,200 in 2022.
The change in the loan limit was based on a 12.2 percent year-over-year increase in FHFA’s “expanded-data” house price index that includes additional source data compared to the more widely quoted flagship index, which showed a 12.4 percent annual increase in third quarter 2022.
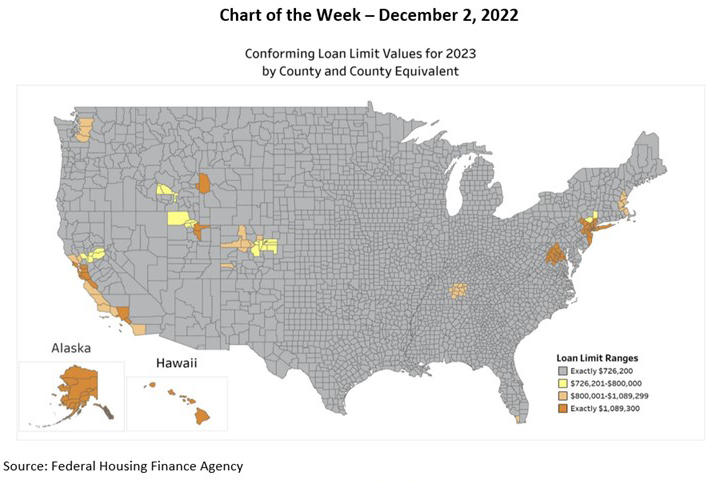
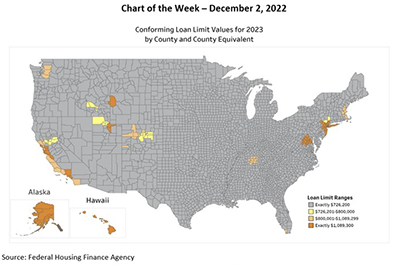
For “high-cost areas” defined by the FHFA as “areas in which 115 percent of the local median home value exceeds the baseline conforming loan limit”, the loan limits are permitted to be higher than the baseline loan limit until a ceiling of 150 percent of the baseline limit is reached. Median home values increased in most high-cost areas in 2022, which increased their limits. The new ceiling loan limit for one-unit properties will be $1,089,300, which is 150 percent of $726,200. Additionally, Alaska, Hawaii, Guam and the U.S. Virgin Islands will use the new ceiling loan limit based on statutory provisions. This week’s Chart of the Week shows a map of US counties and the respective distribution of loan limits.
After reaching 18.9 percent year-over-year growth in first quarter 2022, national home price growth cooled to 12.4 percent in the third quarter, based on the FHFA’s purchase-only house price index. At the metro level, the top 20 metros ranked by annual price growth still registered annual home price growth of between 15 to 30 percent, while the bottom 20 metros saw growth of 8 percent or less, including two metros which saw year-over-year declines.
Looking at quarter-over-quarter change, national home price growth slowed to 0.05 percent, a deceleration from 3.69 percent in the second quarter. This was the smallest quarterly increase since 2011. There were widespread quarterly price declines at the metro level – within the top 20 metros, four had price declines over the quarter, while 16 of the bottom 20 metro areas saw quarterly price declines.
Slowing activity in the purchase market driven by affordability challenges in general, combined with mortgage rates that more than doubled over the year, caused a rapid pullback by buyers. This reduced competition for home buying and cooled price growth in many markets. Our home price forecast is for flat home price growth in 2023 and 2024, which means that many local markets will see price declines, while some may continue to see positive growth over the next two years.
–Joel Kan jkan@mba.org.