November Mortgage Application Payments Fall 1.8% to $1,977
Homebuyer affordability improved in November, with the national median payment applied for by mortgage applicants decreasing 1.8 percent to $1,977 from $2,012 in October, according to the Mortgage Bankers Association’s Purchase Applications Payment Index.
The PAPI measures how new monthly mortgage payments vary across time–relative to income–using data from MBA’s Weekly Applications Survey.
“Slower home-price growth and a 26-basis-point decrease in mortgage rates led to a slight improvement in homebuyer affordability in November,” said Edward Seiler, MBA Associate Vice President of Housing Economics and Executive Director of the Research Institute for Housing America.
Seiler noted that while the median purchase application increased by $2,444 to $297,444, the amount is more than $40,000 below the peak of $340,000 in February 2022. “MBA expects both mortgage rates and home-price growth to moderate, which may encourage additional buyers to return to the housing market in the coming months,” he said.
An increase in PAPI–indicative of declining borrower affordability conditions–means that the mortgage payment to income ratio is higher due to increasing application loan amounts, rising mortgage rates, or a decrease in earnings. A decrease in PAPI–indicative of improving borrower affordability conditions–occurs when loan application amounts decrease, mortgage rates decrease, or earnings increase.
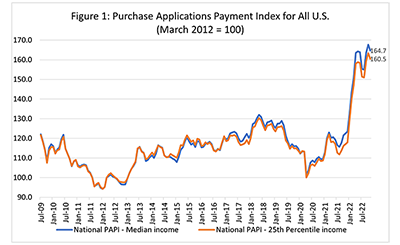
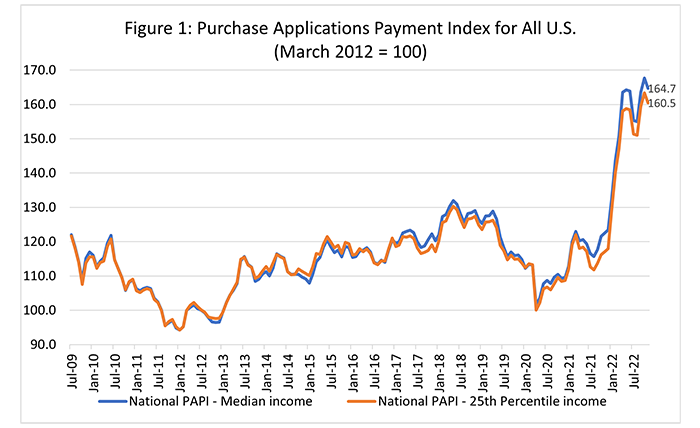
The national PAPI (Figure 1) decreased 1.8 percent to 164.7 in November from 167.6 in October, but is still at the second-highest level dating back to July 2009. Compared to November 2021 (122.6), the index has jumped 33.4 percent in the first 11 months of 2022. For borrowers applying for lower-payment mortgages (the 25th percentile), the national mortgage payment decreased to $1,289 in November from $1,323 in October.
Additional key findings for November:
• The national median mortgage payment fell to $1,977 in November, down from $2,012 in October but up from $1,941 in September. Mortgage payments increased by $594 in the first 11 months of the year, equal to a 42.9% increase.
• The national median mortgage payment for FHA loan applicants fell to $1,631 in November, down from $1,666 in October but up from $1,059 in November 2021.
• The national median mortgage payment for conventional loan applicants fell to $1,994, down from $2,047 in October but up from $1,444 in November 2021.
• States with the highest PAPI were Nevada (272.4), Idaho (262.9), Arizona (231.4), Utah (228.6) and Washington (208.7).
• States with the lowest PAPI were Alaska (104.7), Washington, D.C. (111.1), West Virginia (111.4), Connecticut (116.5) and North Dakota (119.2).
• Homebuyer affordability increased for Black households, with the national PAPI decreasing from 168.1 in October to 165.2 in November.
• Homebuyer affordability increased for Hispanic households, with the national PAPI decreasing from 153.6 in October to 150.9 in November.
• Homebuyer affordability increased for White households, with the national PAPI decreasing from 168.0 in October to 165.0 in November.
About MBA’s Purchase Applications Payment Index:
PAPI measures how new mortgage payments vary across time relative to income. Higher index values indicate that the mortgage payment to income ratio is higher than in a month where the index is lower. Contrary to other affordability indexes that make multiple assumptions about mortgage underwriting criteria to estimate mortgage payment level, PAPI directly uses MBA’s Weekly Applications Survey data to calculate mortgage payments.
PAPI uses usual weekly earnings data from the U.S. Bureau of Labor Statistics’ Current Population Survey. Usual weekly earnings represent full-time wage and salary earnings before taxes and other deductions and include any overtime pay, commissions, or tips usually received. Note that data are not seasonally adjusted.
The rent data series calculated for MBA’s national mortgage payment to rent ratio comes from the U.S. Census Bureau’s Housing Vacancies and Homeownership survey’s median asking rent. The HVS data is quarterly, and as such, the mortgage payment to rent ratio will be updated quarterly. Note: mortgage payment to rent ratio data is not included in this November release.
Click here for additional information about MBA’s Purchase Applications Payment Index.