The ‘Great House Moderation’ Varies by Market
Reports from First American Financial Corp., Santa Ana, Calif., and Black Knight, Jacksonville, Fla., show the “Great House Moderation” accelerating, with some markets experiencing steeper slowdowns than others.
The monthly First American Real Price Home Index said while home price moderation continued to decelerate in June from its March peak, all markets are not created equal, with substantial variations in local markets.
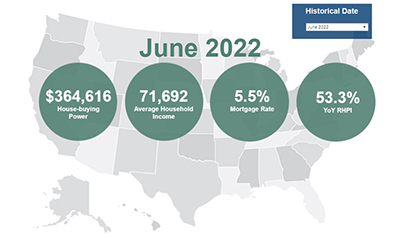
The report said real house prices increased by 3.7 percent between May and June, and by 53.3 percent year over year. Consumer house-buying power decreased by 2.8 percent between May and June and decreased by 22.7 percent year over year. Median household income has increased 4.7 percent since June 2021 and by 72.5 percent since January 2000.

The report said real house prices are 32.9 percent more expensive than in January 2000. While unadjusted house prices are now 54.8 percent above the housing boom peak in 2006, real, house-buying power-adjusted house prices remain 6.4 percent below their 2006 housing boom peak.
“Nationally, annual house price growth peaked in March at nearly 21 percent, but has since decelerated slightly to a still-robust 18.5 percent in June,” said First American Chief Economist Mark Fleming. “However, the modest price deceleration is not a national phenomenon. While house price growth has slowed in all top 50 markets we track, the pace of moderation varies significantly by market.”
For example, in Sacramento, Calif., annual house price appreciation peaked in July 2021 at 23.5 percent, but has since slowed to 10.8 percent. The market with the smallest gap, on the other hand, was New York. House price appreciation in New York did not accelerate as fast as in other markets and was well below the national peak, only reaching 13 percent on an annual basis at its peak in May 2021 and it remains at nearly that same pace in June.
The report said while all top 50 markets are pulling back from their respective peaks in price appreciation, some markets have decelerated faster than others. The market with the slowest annual pace of price appreciation in June was San Francisco at 6.2 percent, down significantly from its July 2021 pace of 17.5 percent. Conversely, the market with the fastest pace of appreciation in June was Miami at 33.8 percent, which is nearly the same pace as its peak of 34.4 percent in May 2022.
“The record-breaking house price appreciation nationwide and across markets in 2021 and early 2022 was due to a supply and demand imbalance – too much demand, too little supply,” Fleming said. “There remains a structural and long-term national supply shortage in the housing market, but in some cities the pullback in demand is strong and inventory is rising faster, resulting in a greater moderation of house price growth.”
The report said states with the greatest year-over-year increase were Florida (+75.6), South Carolina (+63.7 percent), Georgia (+61.6), North Carolina (+61.5 percent), and Arizona (+60.2 percent). No states reported a year-over-year decrease.
Among metros tracked by First American, markets with the greatest year-over-year increase were Tampa, Fla. (+70.6 percent), Charlotte, N.C. (+69.8), Raleigh, N.C. (+69.6 percent), Miami (+68.4 percent) and Orlando (+66.4 percent). No markets showed a year-over-year decrease.
Meanwhile, Black Knight reported home price growth in July at a 14.3 percent annual rate—still historically quite strong (three times the long-term average), but warned of a more immediate impact of underlying price pull backs taking place. Black Knight said the median home price fell for the first time in 32 months.
Black Knight reported annual HPA slowed by another 2.5 percent in July – surpassing June as the strongest single month of slowing in more than 40 years – and is now down by 4.9 percent over the past two months alone. On a month-over-month basis, the average home price fell by 0.77% in July – the largest single month decline since January 2011, and the second worst July on record. Only July 2010 (-0.90%) saw a larger single month drop.
“More price corrections are likely on the horizon as we move into what are typically more neutral seasonal months for the housing market,” Black Knight said. “Even during the Great Financial Crisis, prices typically rose marginally during Mar-May, with effectively all price drops taking place from July through February (see that first chart for a visual representation).
As with the First American report, Black Knight noted while prices are only off peak by less than 1% nationally, some markets have seen much more significant declines. More than 85% of major markets are at least marginally off their peaks through July, with a third seeing >1% declines and more than one in 10 seeing prices fall by 4% or more.