MBA: Lower Mortgage Rates, Loan Amounts Improve July Homebuyer Affordability in 47 States
Homebuyer affordability improved for the second straight month in July, with the national median payment applied for by applicants decreasing to $1,844 from $1,893 in June, the Mortgage Bankers Association reported Wednesday.
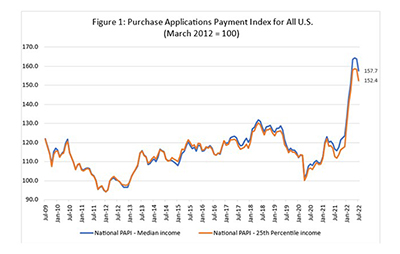
The MBA Purchase Applications Payment Index (Figure 1) decreased by 3.8 percent to 157.7 in July from 163.9 in June, meaning payments on new mortgages take up a smaller share of a typical person’s income. From a year ago (116.6), the index has jumped by 35.2 percent. For borrowers applying for lower-payment mortgages (the 25th percentile), the national mortgage payment was decreased between June and July from $1,241 to $1,210.
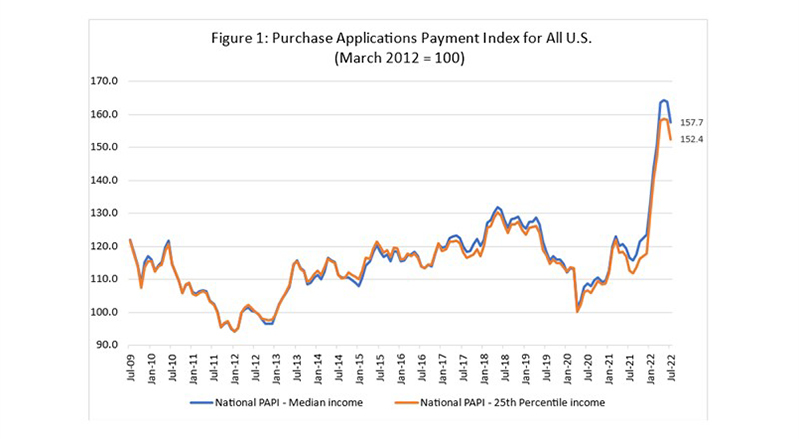
“Affordability conditions improved modestly in most of the country in July, as slightly lower mortgage rates and a decrease in the median loan amount led to the typical homebuyer’s mortgage payment falling $49 from June,” said Edward Seiler, MBA Associate Vice President of Housing Economics and Executive Director of the MBA Research Institute for Housing America. “Homebuyer demand has faltered this summer, as lingering economic uncertainty, high inflation and still-high mortgage rates caused many prospective buyers to delay their home search. The combination of a strong job market and moderating home-price growth could entice some of these buyers to return in the coming months.”
The PAPI measures how new monthly mortgage payments vary across time – relative to income – using data from MBA’s Weekly Applications Survey. An increase in the PAPI – indicative of declining borrower affordability conditions – means that the mortgage payment to income ratio is higher due to increasing application loan amounts, rising mortgage rates, or a decrease in earnings. A decrease in the PAPI – indicative of improving borrower affordability conditions – occurs when loan application amounts decrease, mortgage rates decrease, or earnings increase.
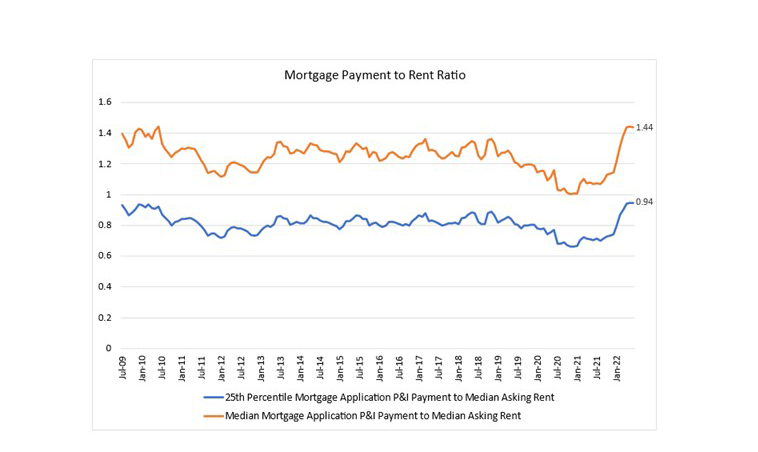
The MBA national mortgage payment to rent ratio increased to 1.44 at the end of the second quarter (June 2022) from 1.38 at the end of the first quarter (March), meaning mortgage payments for home purchases have increased relative to rents. The national median asking rent in second-quarter 2022 increased 4.7 percent on a quarterly basis to $1,314 ($1,255 in the first quarter). The 25th percentile mortgage application payment to median asking rent ratio was 0.94 in June, up from 0.90 in March.
“Rent growth has remained incredibly strong in recent quarters, but the influx of new developments coming onto the market should alleviate some of the affordability pressures that are affecting renters in many parts of the country,” Seiler said.
Additional Key Findings of the MBA Purchase Applications Payment Index – July
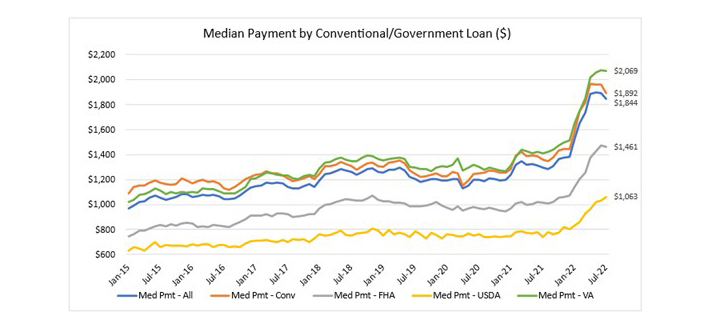
- The national median mortgage payment fell to $1,844 in July, down from $1,893 in June and $1,897 in May. Monthly payments are still up by $461 in the first seven months of the year – equal to a 33.3% increase.
- Of 50 states (and Washington, D.C.), 47 had lower PAPI values in July than in June. This includes nine of the top 10 states with the highest PAPI values.
- The national median mortgage payment for FHA loan applicants fell to $1,461 in July, down from $1,474 in June, but up from $1,015 a year ago.
- The national median mortgage payment for conventional loan applicants fell to $1,892, down from $1,959 in June, but up from $1,361 a year ago.
- States with the highest PAPI were: Idaho (250.8), Nevada (249.6), Arizona (230.5), Utah (209.9) and Florida (201.1).
- States with the lowest PAPI were: Washington, D.C. (101.4), Connecticut (105.1), Alaska (110.3), Louisiana (110.9), and West Virginia (116.6).
- Homebuyer affordability increased for Black households, with the national PAPI decreasing from 159.2 in June to 153.1 in July.
- Homebuyer affordability increased for Hispanic households, with the national PAPI decreasing from 154.9 in June to 149.0 in July.
- Homebuyer affordability increased for white households, with the national PAPI decreasing from 164.7 in June to 158.5 in July.
About the MBA Purchase Applications Payment Index
The Mortgage Bankers Association’s Purchase Applications Payment Index measures how new mortgage payments vary across time relative to income. Higher index values indicate that the mortgage payment to income ratio is higher than in a month where the index is lower. Contrary to other affordability indexes that make multiple assumptions about mortgage underwriting criteria to estimate mortgage payment level, PAPI directly uses MBA’s Weekly Applications Survey data to calculate mortgage payments.
PAPI uses usual weekly earnings data from the U.S. Bureau of Labor Statistics’ Current Population Survey. Usual weekly earnings represent full-time wage and salary earnings before taxes and other deductions and include any overtime pay, commissions, or tips usually received. Note that data are not seasonally adjusted.
The rent data series calculated for MBA’s national mortgage payment to rent ratio comes from the U.S. Census Bureau’s Housing Vacancies and Homeownership (HVS) survey’s median asking rent. The HVS data is quarterly, and as such, the mortgage payment to rent ratio will be updated quarterly.
For additional information on MBA’s Purchase Applications Payment Index, click here.