MBA: March Median Mortgage Application Payment Jumps 5% to $1,736
Homebuyer affordability declined in March, with the national median payment applied for by applicants rising 5 percent to $1,736 from $1,653 in February, the Mortgage Bankers Association reported Thursday.
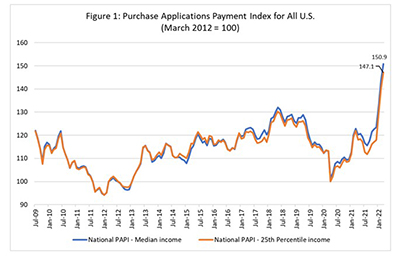
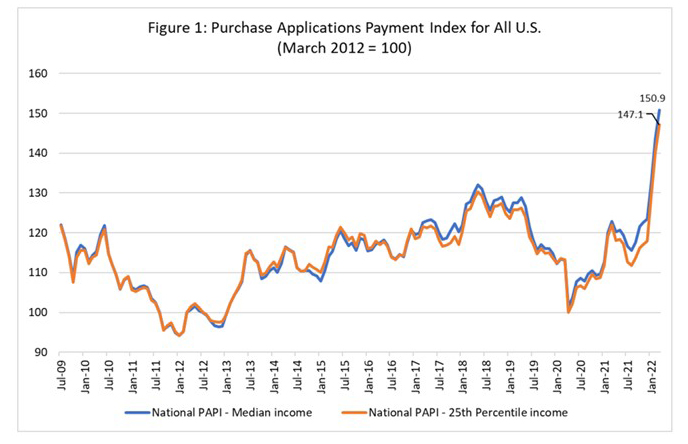
The national MBA Purchase Applications Payment Index increased by 5 percent to 150.9 in March from 143.7 in February, meaning payments on new mortgages take up a larger share of a typical person’s income. From a year ago (122.9), the index jumped by 22.8 percent. For borrowers applying for lower-payment mortgages (25th percentile), the national mortgage payment increased by 3.2 percent to $1,129 from $1,094 in February.
“The start of the spring homebuying season is off to a mixed start,” said Edward Seiler, MBA Associate Vice President of Housing Economics and Executive Director of the Research Institute for Housing America. “The healthy labor market and robust wage gains fueled demand throughout the country in March, but rapid home-price growth and the 42-basis-point surge in mortgage rates slowed purchase application activity.”
Seiler noted a typical borrower’s principal and interest payment was $387 more than a year ago. “Swift price-appreciation, sky-high inflation, low inventory and mortgage rates now two percentage points higher than last year are all headwinds for the housing market in the coming months – especially for first-time buyers,” he said. “MBA’s updated forecast calls for an annual decline in existing sales, elevated home prices and mortgage rates, and a smaller, but solid 4 percent gain in purchase origination volume.”
The PAPI measures how new monthly mortgage payments vary across time – relative to income – using data from the MBA Weekly Applications Survey. An increase in the PAPI – indicative of declining borrower affordability conditions – means that the mortgage payment to income ratio is higher due to increasing application loan amounts, rising mortgage rates, or a decrease in earnings. A decrease in the PAPI – indicative of improving borrower affordability conditions – occurs when loan application amounts decrease, mortgage rates decrease, or earnings increase.
Additional key findings for March:
–The national median mortgage payment applied for by applicants rose to $1,736 in March, up from $1,653 in February, $1,526 in January and $1,349 in March 2021.
–The national median mortgage payment for FHA loan applicants rose to $1,254 in March, up from $1,201 in February and $1,018 in March 2021.
–The national median mortgage payment for conventional loan applicants rose to $1,819 in March, up from $1,750 in February and $1,424 in March 2021.
–States with the highest PAPI were Idaho (241.2), Nevada (223.9), Arizona (200.7), California (192.5) and Utah (190.9).
–States with the lowest PAPI were Washington, D.C. (89.1), Alaska (98.1), Connecticut (98.4), West Virginia (106.8) and Louisiana (107.1).
–Homebuyer affordability decreased for Black households, with the national PAPI increasing from 146.5 in February to 153.8 in March.
–Homebuyer affordability decreased for Hispanic households, with the national PAPI increasing from 137.5 in February to 144.4 in March.
–Homebuyer affordability decreased for White households, with the national PAPI increasing from 144.4 in February to 151.6 in March.
About the MBA Purchase Applications Payment Index
The Mortgage Bankers Association’s Purchase Applications Payment Index measures how new mortgage payments vary across time relative to income. Higher index values indicate that the mortgage payment to income ratio is higher than in a month where the index is lower. Contrary to other affordability indexes that make multiple assumptions about mortgage underwriting criteria to estimate mortgage payment level, PAPI directly uses MBA’s Weekly Applications Survey data to calculate mortgage payments.
PAPI uses usual weekly earnings data from the U.S. Bureau of Labor Statistics’ Current Population Survey. Usual weekly earnings represent full-time wage and salary earnings before taxes and other deductions and include any overtime pay, commissions, or tips usually received. Note that data are not seasonally adjusted.
The rent data series calculated for MBA’s national mortgage payment to rent ratio comes from the U.S. Census Bureau’s Housing Vacancies and Homeownership survey’s median asking rent. The HVS data is quarterly, and as such, the mortgage payment to rent ratio will be updated quarterly.
For additional information on MBA’s Purchase Applications Payment Index, click here.