Home Price Report: Double-Digit Growth Pushes On, Though a Bit Slower
A slew of reports Monday confirmed that home price growth continues to move along at a breakneck pace, but show signs of slowing.
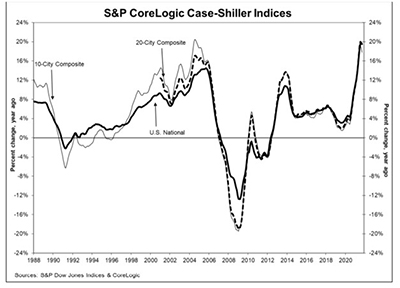
The S&P CoreLogic Case-Shiller Indices reported a 19.5 percent annual gain in September, down only slightly from the record 19.8 percent gain in August—but the first deceleration in the report in 14 months. The Federal Housing Finance Agency reported an 18.5 percent annual gain through the third quarter.
And First American Financial Corp., Santa Ana, Calif., said despite the double-digit percentage home price increases of the past year, there is still room for more home price growth ahead.
The S&P CoreLogic Case-Shiller U.S. National Home Price NSA Index reported a 19.5% annual gain in September, down from 19.8% in August. The 10-City Composite annual increase came in at 17.8%, down from 18.6% in the previous month. The 20-City Composite posted a 19.1% year-over-year gain, down from 19.6% in the previous month.
Phoenix led metros with a 33.1% year-over-year price increase, followed by Tampa at 27.7% and Miami at 25.2%. Six of the 20 cities reported higher price increases in the year ending September versus the year ending August.
Month over month, before seasonal adjustment, the U.S. National Index posted a 1.0% increase in September, while the 10-City and 20-City Composites posted increases of 0.7% and 0.8%, respectively. After seasonal adjustment, the U.S. National Index posted a month-over-month increase of 1.2%; the 10-City and 20-City Composites posted increases of 0.8% and 1.0%, respectively. Nineteen of the 20 cities reported increases before seasonal adjustments, while all 20 cities reported increases after seasonal adjustments.
“Choose only one word to describe September 2021’s housing price data, the word would be ‘deceleration,’ said Craig J. Lazzara, Managing Director with S&P DJI. “Housing prices continued to show remarkable strength in September, though the pace of price increases declined slightly.”
“While housing market activity is experiencing a typical seasonal slowdown, home buyer demand remains strong and continues to push total home purchases above pre-pandemic levels, resulting in another month of close to 20% annual gains in home prices,” said Selma Hepp, Deputy Chief Economist with CoreLogic, Irvine, Calif. “Nevertheless, while activity continues to outperform pre-pandemic levels, there are encouraging signs of a slow albeit welcomed return to more sustainable balance between buyers and sellers. There is still low availability of for-sale homes, which continues to drive price growth, but the competition has faded and assuaged some of the bidding war intensity. Overall, home price growth is likely to continue slowing over the next year.”
S&P said as of September, average home prices for the MSAs within the 10-City and 20-City Composites are exceeding their winter 2007 levels.
Meanwhile, FHFA said U.S. house prices rose 18.5 percent from third quarter 2020 to third quarter 2021 according to its House Price Index. House prices rose by 4.2 percent from the second quarter, while the seasonally adjusted monthly index for September rose by 0.9 percent from August.
“House price appreciation reached its highest historical level in the quarterly series,” said William Doerner, Supervisory Economist in FHFA’s Division of Research and Statistics. “Compared to a year ago, annual gains have increased in every state and metro area. Real estate prices have risen exceptionally fast, but market momentum peaked in July as month-over-month gains have moderated.”
The report said house prices rose in all 50 states and the District of Columbia annually; states with the highest annual appreciation were Idaho 35.8 percent; Utah 30.3 percent; Arizona 27.7 percent; Montana 26.0 percent; and Florida 24.8 percent. Areas showing the lowest annual appreciation were the District of Columbia 8.0 percent; North Dakota 10.5 percent; Louisiana 10.9 percent; Maryland 12.5 percent; and Iowa 13.0 percent.
House prices rose in all of the top 100 largest metropolitan areas over the last four quarters. Annual price increases were greatest in Boise City, Idaho, where prices increased by 37.3 percent. Prices were weakest in Philadelphia, where they increased by 9.9 percent.
Of the nine census divisions, the Mountain division recorded the strongest four-quarter appreciation, posting a 25.0 percent gain annually and a 5.8 percent increase in the third quarter. Annual house price appreciation was weakest in the West North Central division, where prices rose by 14.8 percent.
But according to the First American Real House Price Index, home prices still have room to grow. The Index, which measures housing affordability in the context of changes in consumer house-buying power, said affordability in September declined to its lowest level since 2008. Two of the three components of consumer house-buying power swung toward declining affordability.
“It may be hard to believe but, once adjusted for consumer house-buying power, housing is undervalued in most markets and the gap between house-buying power and median sale prices indicates there remains room for continued house price growth,” said First American Chief Economist Mark Fleming.