CMBS Market Musings: Trophy Asset and Transitional Loan Transactions Thrive
(One Vanderbilt.)
(Andrew Foster is Associate Vice President in MBA’s Commercial/Multifamily Group. He is a former Analyst with S&P Global Ratings and Fitch Ratings as well as a regular contributor to MBA NewsLink. He can be reached at afoster@mba.org.)

A strong economic recovery expectation is the story heading into spring along with vaccination challenges. The market seems more concerned with potential for rising inflation, interest rates and taxes, which is perhaps a welcome mental break from global pandemic concerns. The private-label CMBS market remains a mixed bag, showing signs of a K-shaped recovery in the second quarter with delinquency and default numbers trending down now for nine consecutive months. The marketplace’s overall bond issuance expectations for 2021 have generally increased compared to the beginning of the year, with some products outperforming (Single Asset Single Borrower “SASB” and Commercial Real Estate Collateralized Loan Obligations “CRE CLOs”), while others underdeliver (Conduit).
Bloomberg details here: “investors are pouring money into bonds backed by U.S. offices, shrugging off concerns about whether workers will ever fill them up like they did before the pandemic. About a third of all this year’s commercial mortgage-backed securities tied to single properties (SASB) — nearly $4 billion in total — have helped finance prime office towers in large city centers…. that is despite the fact that Covid-19 has eviscerated demand for office space, decimating rents and slashing valuations. Overall private-label CMBS issuance stands at $29.5 billion this year, 19% higher than at this point in 2020.”
The most recent example? One Vanderbilt, a recently completed skyscraper near Grand Central Station. The Real Deal reports here: “Goldman Sachs and Wells Fargo are leading a massive refinancing of One Vanderbilt. The financing package is expected to close in June. The lenders plan to securitize the debt into a huge single-asset, single-borrower CMBS deal, generally reserved for blue-chip buildings.”
House of the Rising Issuance Forecast
Given the first four months of the year, the pipeline and outlook, Bank of America Analyst Alan Todd writes, “we revised our 2021 private label CMBS gross issuance forecast to $80-95 billion. Specifically, we now expect that conduit issuance will total $20-25 billion (down from $35-40bn), SASB will total $35-40 billion (up from $30-35bn) and CRE CLO/other private label CMBS issuance will total $25-30 billion (up from $15bn).”
Meanwhile, a JPMorgan Analyst writes, “This week, we revise our 2021 full-year private label issuance forecast higher by 11% to $92bn from our original forecast of $83bn, largely driven by higher issuance expectations for SASB and CRE CLOs, partially offset by lower conduit issuance expectations.”
Commercial Mortgage Alert polls some industry leading insiders each January and industry expectations have risen in just the past three months. The range of expectations for US CMBS volume per CMA survey were from $60 billion to $95 billion with an average of $76 billion as compared to actual 2020 volume of $59.3 billion. Predictions for CRE CLO volume ranged from $8 billion to $20 billion with an average of $14 billion as compared to actual 2020 volume of $8.7 billion.
Sink or Swim: CMBS Delinquencies Dribble Down
The CMBS delinquency rate published monthly by Trepp was 6.58% in March, which represented just over 20 basis point drop from the February reading. Trepp notes: “In February, the rate saw the biggest drop since the start of the COVID-19 pandemic. As for March, the percentage of loans in the 30 days delinquent bucket is 0.70%, up 12 basis points for the month. In terms of loans in grace period, 1.92% of loans by balance missed the March payment but were less than 30 days delinquent. That was down 38 basis points for the month and could be a sign that even more delinquency rate improvements are on the way.
“The percentage of loans with the special servicer fell to 9.39% in March from 9.60% in February. According to March servicer data, 24.2% of all lodging loans were in special servicing, virtually unchanged in March. In addition, 16.1% of retail loans are with the special servicer, down from 16.7% in February.
“The percentage of loans on servicer watchlist climbed to 24.7% in March from 23.4% in February.
“Our numbers above reflect percentages that assume defeased loans are still part of the denominator.”
The below chart from Fitch shows the agency-rated monthly volumes for specially servicing:
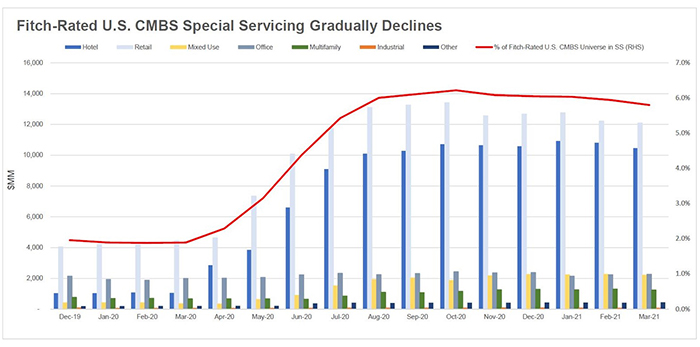
Providing some context to the moving parts involved in calculating the monthly delinquency rate, Fitch Ratings notes some interesting observations in below research which can be found here:
“Fitch Ratings’ U.S. CMBS delinquency rate dropped 23 bps to 4.10% in March from 4.33% in February. Both resolution activity and new issuance volume remain strong, and the pace of new delinquencies has slowed considerably. Resolutions totaled $1.6 billion in March, compared with $2.1 billion in February. The bulk of the resolutions consisted of eight regional mall loans ($951 million), which were no longer reported as 60+ days delinquent; two of these loans were modified, five were resolved through the reapplication of funds for debt service and the borrower funded shortfalls for one loan. New delinquencies fell to $697 million in March from $1.1 billion in February; this is the lowest monthly new delinquency volume since the start of the pandemic and well below the June 2020 peak of $10.8 billion.”
MBA reported March data in April demonstrating that because of the concentration of hotel and retail loans, CMBS loan delinquency rates are higher than other capital sources. All major capital sources saw a lower share of loan balances non-current than a month earlier.
- 8.7% of CMBS loan balances were non-current, down from 9.3% a month earlier.
- Non-current rates for other capital sources were more moderate.
- 2.1% of FHA multifamily and health care loan balances were non-current, down from 2.7% a month earlier.
- 1.6% of life company loan balances were non-current, down from 2.0%.
- 1.2% of GSE loan balances were non-current, down from 1.3% a month earlier.
Flight to Quality Over Quantity
Alan Todd writes, “despite the surge in private label CMBS issuance, it won’t be spread evenly across the sub-types. Whereas SASB and CRE CLO issuance are on pace to surpass last year’s issuance at this point in time, conduit issuance between January and May 2021 is expected to total only $9.8 billion, which represents a 37% decrease versus issuance last year over the same period of time. On the other hand, SASB issuance between January and May 2021 is expected to total $16.3 billion, which represents a 54% increase from issuance last year over the same time period. Similarly, CRE CLO/other private label CMBS issuance between January and May 2021 is expected to total $13.0 billion, which represents a 180% increase from issuance last year over the same period.”
While conduits may be underperforming the expectations of market participants, its return to some baseline level of execution frequency has been quick compared to the last recession. The somewhat negligible value of pool diversity with the continued challenges in retail, hospitality and office asset classes will likely continue to cap issuance volume; however, continued improved performance for existing CMBS transactions should help investor sentiment and demand prospects for new originations. This could have the spillover effect of driving increased conduit issuance likely by the fourth quarter.
Moody’s Downgrades Due to Increased Loss Expectations
Moody’s announced April 23 it downgraded 156 bonds from 36 conduit CMBS transactions. Further, it placed 15 bonds under review for possible downgrade from two conduit CMBS transactions.
Bank of America’s Alan Todd explains in a research note, according to the accompanying commentary from Moody’s, the rating downgrades on the 119 P&I bonds were caused primarily by increased loss expectations and higher interest shortfall risk to the transactions because of the continued cash flow and value deterioration for specially serviced, delinquent or otherwise poorly performing loans backed by lower quality malls. The higher loss expectations for these transactions also reflect further deterioration of hotel and office properties that even before the onset of the COVID-19 pandemic suffered from declining revenue or other credit risks.
The ratings on the 26 IO bonds were downgraded due to a decline in credit quality of their referenced classes. The ratings on the 11 exchangeable classes were downgraded due to a decline in credit quality of their referenced exchangeable classes.