MBA Chart of the Week May 24 2021: Retail Production Channel Loan Officer Turnover
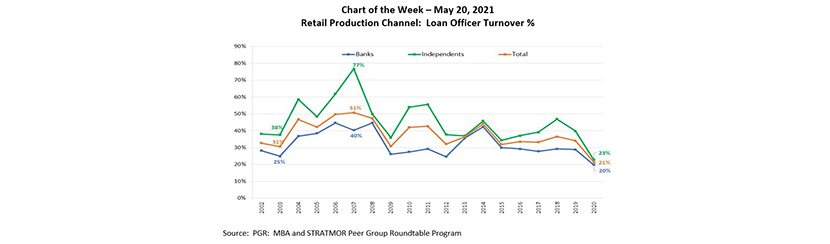
This week’s chart shows the historical retail Loan Officer turnover rates (%) for depository banks and independent mortgage companies, based on data collected through the MBA and STRATMOR Peer Group Roundtable Program, now in its 23rd year of production.
From 2002 to 2020, the LO turnover rate averaged 38%, but fluctuated based on market conditions. For example, the turnover rate reached a survey low of 21% in 2020 – a time when industry volume reached a record $3.8 trillion, topping the previous record year of 2003. Coincidentally, 2003 was the year with the second-lowest LO turnover rate of 31%. Loan officers were doing too well and/or were too busy to transition to a new company in these years. Likewise, in years with weaker originations volume or major market disruptions –such as 2007, 2010-2011, 2014 and 2018 – the LO turnover rate increased. None more so than in 2007 at the start of the Great Recession, when LO turnover peaked at a survey-high 51%.
In addition, LO turnover has fluctuated based on company type. During this time period, banks had lower average LO turnover than independents by approximately 13 percentage points. In 2007, the turnover rate among independents reached as high as 77%. LO turnover among banks was as high as 45% in 2006 and 2008, but never reached more than 50%. Factors that may explain this differential include management approach towards loan officer performance, company culture, licensing requirements, incentive compensation, availability of product offerings and pricing parameters.
NOTE: Retail loan officer turnover is measured by taking the total number of voluntary and involuntary terminations for the year, then dividing by the average number of retail loan officers employed over the year. Data collected in 2020 represents 103 firms.
–Marina Walsh, CMB mwalsh@mba.org.