Despite Price Spikes, Homeownership Remains Affordable
Two reports—from ATTOM Data Solutions, Irvine, Calif., and First American Financial Corp., Santa Ana, Calif.—say despite sharp spikes in home prices, homeownership remains affordable for most workers, which continues to drive housing demand.
ATTOM released its first-quarter 2021 U.S. Home Affordability Report, showing median home prices of single-family homes and condos in the first quarter were more affordable than historical averages in 52 percent of counties with enough data to analyze. That was down from 63 percent of counties in the first quarter of 2020 and 95 percent during the same period five years ago. But rising wages and falling mortgage rates still compensated for near-20 percent spikes in home prices over the past year, helping to keep median home prices affordable for average wage earners around the country.
The report determined affordability for average wage earners by calculating the amount of income needed to meet monthly home ownership expenses — including mortgage, property taxes and insurance — on a median-priced home, assuming an 80 percent down payment and a 28 percent maximum “front-end” debt-to-income ratio.
Compared to historical levels, median home prices in 287 of the 552 counties analyzed in the first quarter were more affordable than past averages. That was down from 349 of the same group of counties in the first quarter of 2020, a trend that came during a 12-month period when the national median home price shot up 18 percent, to $278,000, in the first quarter.
But the report noted with workplace pay rising and home mortgage rates continuing to hit historic lows, major expenses on a median-priced home nationwide still consumed just 23.7 percent of the average wage across the country in the first quarter. That figure was up from 22 percent a year ago and from 19.7 percent five years ago. But it remained well within the 28 percent standard lenders prefer for how much homeowners should spend on those major expenses.
“The past year certainly has been an odd one for the U.S. housing market,” said Todd Teta, chief product officer with ATTOM Data Solutions. “ Home prices surged at a remarkable pace even as the virus pandemic damaged the U.S. economy, which dropped historical affordability levels. But average workers untarnished by the pandemic were still able to afford the typical home because wages and rock-bottom interest rates worked to their favor in a big way. Much remains uncertain about the housing market in 2021. A lot will depend on how well the broader U.S. economy recovers from the pandemic and whether there are still many more buyers looking to escape congested neighborhoods most prone to the virus, pushing prices even higher. But for now, our data shows that average workers are able to manage the costs associated with rising values.”
Among the 552 counties in the report, 327 (59 percent) had major home-ownership expenses on typical homes in the first quarter that were affordable for average local wage earners, based on the 28-percent guideline. The largest of those counties were Cook County (Chicago), Ill.; Harris County (Houston), Texas; Dallas County, Texas; Bexar County (San Antonio), Texas and Wayne County (Detroit), Mich..
The most populous of the 225 counties where major expenses on median-priced homes were unaffordable for average local earners in the first quarter (41 percent of the counties analyzed) were Los Angeles County, Calif.; Maricopa County (Phoenix), Ariz.; San Diego County, Calif.; Orange County, (outside Los Angeles), Calif. and Miami-Dade County, Fla.
In a separate report, First American released its monthly Real Home Price Index, showing home prices, adjusted for wages, inflation, interest rates and other factors, increased by 1.2 percent between December and January. From a year ago, real house prices fell by nearly 5 percent.
The report said consumer house-buying power—how much one can buy based on changes in income and interest rates—increased by 0.4 percent between December and January and increased 18.9 percent year over year. It noted median household income has increased 6.2 percent since January 2020 and by 74.8 percent since January 2000.
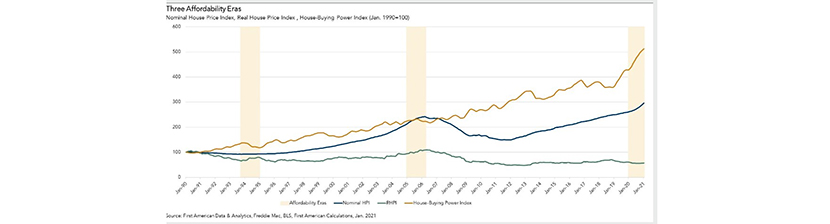
First American Chief Economist Mark Fleming said real house prices are 25.6 percent less expensive than in January 2000. While unadjusted house prices are now 22.2 percent above the housing boom peak in 2006, real, house-buying power-adjusted house prices remain 47.8 percent below their 2006 housing boom peak.
It is true that nominal house prices are the highest they have ever been, over 22 percent higher than the housing boom peak in 2006,” Fleming said. “Despite rapidly rising nominal house prices, affordability actually improved, with the RHPI falling nearly 5 percent during the same time period. In fact, while nominal house prices are now more than 22 percent above the housing boom peak in 2006, real, house-buying power-adjusted, prices are 48 percent below their 2006 housing boom peak. The lesson? In housing, you can’t judge a housing market ‘book’ by its nominal house price ‘cover.’ Affordability is dependent on house-buying power.”
Fleming said as rates rise, affordability may become an issue for some buyers on the margin. “As these buyers pull back from the market and sellers adjust their expectations, house price appreciation will adjust,” he said. “But, the improving economic conditions and the ongoing shortage of supply relative to demand continue to support house price growth. The underlying fundamental housing market conditions support a moderation of house price appreciation which, alongside a healthier labor market and still historically low mortgage rates, should keep housing affordable.”
The report said states with the greatest year-over-year increase in the RHPI are Wyoming (+3.4 percent), Arizona (+1.5 percent), Oklahoma (+1.1 percent), Ohio (+0.8 percent) and Alaska (+0.1 percent). States with the greatest year-over-year decrease in the RHPI are Louisiana (-8.7 percent), California (-8.4 percent), Illinois (-7.6 percent), Massachusetts (-7.4 percent) and New York (-7.3 percent).
Among the metros tracked by First American, markets with the greatest year-over-year increase in the RHPI are Kansas City, Mo. (+5.3 percent), Memphis, Tenn. (+4.3 percent), Tampa, Fla. (+3.7 percent), Cleveland (+3.5 percent) and Hartford, Conn. (+3.0 percent). Markets with the greatest year-over-year decrease in the RHPI are San Francisco (-16.8 percent), San Jose, Calif. (-13.6 percent), Miami (-11.4 percent), Boston (-11.4 percent) and Dallas (-9.1 percent).