Portfolio Risk Management: Repurchase Risk for Non-QM Mortgages

Jonathan Glowacki, FSA, CERA, CSPA, MAAA, Milliman; Edem Togbey, ACAS, MAAA, Milliman; Arthur Prieston, CMB, Principal, Prieston & Associates; Zach Prieston, Vice President, Prieston & Associates.
Background
In the wake of the 2008 global financial crisis, many risk managers in the mortgage issuance industry were caught flat-footed with representations and warranties exposure, also commonly known as repurchase exposure. R&W agreements often require the issuer of mortgages to repurchase the loans and make whole the investors if the loans are found to breach the seller guidelines.

Many banks and nonbanks had not fully accounted for this risk on their balance sheets as historically there had been few R&W requests from investors. The primary causes of the accumulated repurchase exposure were lax underwriting standards and a lack of proper oversight and quality control in the loan issuance pipeline.

After the crisis, as a whole, the industry has tightened up its processes and controls around the issuance of mortgage loans. Government-sponsored enterprises such as Fannie Mae and Freddie Mac have kept a watchful eye on lenders and introduced provisions to deal with the accumulated R&W exposure.

Lenders have responded by improving the quality of the loans issued and backed by the GSEs. The improvement in the quality of the mortgages issued by lenders has resulted in fewer R&W requests from the GSEs, but it has come at an increasing cost of doing business, with the average cost to originate a loan in the retail channel exceeding $10,000 in 2018.[1]
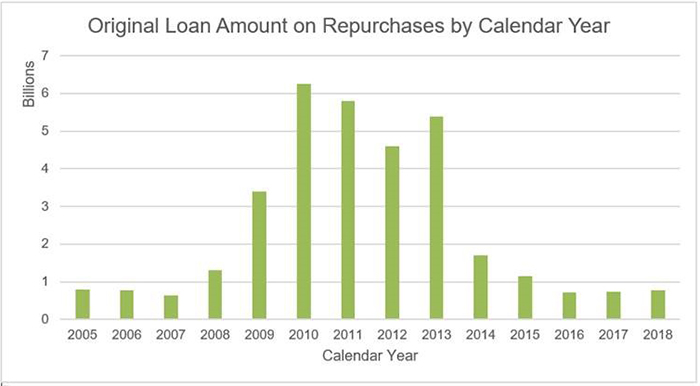
Evidence of the increase and subsequent decline in R&W requests is shown in Figure 1. R&W repurchases peaked in 2010 at just over $10 billion and were less than $1 billion in 2018. These values include GSE business only.
Figure 1: Original Loan Amount on Repurchases by Calendar Year[2]
This risk management success can be attributed to many factors, including but not limited to the increased guidance from the GSEs, hindsight understanding of the risk, and better risk management processes and clarifications of regulatory requirements. The Ability-To-Repay (ATR) / Qualified Mortgage (QM) regulation, in particular, introduced by the Consumer Financial Protection Bureau, has created a standardized framework around which mortgage issuers can focus and manage their risks properly. The ATR regulation framed up the conversation around the definition of QM. Lenders have reacted to this favorable development of fewer R&W requests by decreasing R&W reserves. This is a process known as reserve release. Releasing reserves can help lenders free up capital that can be used in other parts of the organization. In a previous article, we noted that R&W reserve releases should be managed carefully to ensure that appropriate accounting law and business needs are fully met.[3]
The low volume of repurchase requests from the GSEs for QM loans could be viewed as a result of prudent risk management improvement by the mortgage industry and its risk managers, but one has to be mindful of the constantly changing landscape in this industry. In the past few years, while the overall mortgage origination market had been stagnant or declining, the non-QM category started to grow and now the forecasts of a thriving non-QM market are finally coming to realization.
Growth of non-QM loans
In 2015, the first non-agency issuer pushed into new territory with transactions that included non-QM loans, which refers to loans that are not “Qualified Mortgage.” Non-QM loans are designed to serve home buyers who do not fall under the strict lending process of conventional loans. Since 2015, which saw $400 million brought to market, non-QM loans have grown swiftly. Non-QM securitizations have gone from practically nothing to billions of dollars in mortgage bonds in 2019 alone.[4]
The non-QM market saw $35 billion of origination, or 1.7% of all originations, up from $7 billion or 0.4% in 2017.[5] Non-QM securitizations increased to more than $20 billion in 2019 from $9 billion in 2018 and $3 billion in 2017, demonstrating the financing market support for non-QM expansion.[6] Last year, Nomura estimated that non-QM lending volume could grow to more than $100 billion within 10 years.[7] Since then, most market observers believe that non-QM is still in its infancy, with some experts forecasting the market to reach anywhere from $100 billion to $300 billion per year.[8] As large banks focused exclusively on traditional QM loans, nonbanks led the charge into new generation non-QM residential mortgage-backed security (RMBS) products, and today they continue to dominate the market.
Although the non-QM market is just a small piece of today’s mortgage market, it plays a key role in meeting the credit needs for home buyers who are not able to obtain financing through a GSE or government channels.[9] Creditworthy borrowers not applying for GSE or government-insured loans may benefit from non-QM options. These borrowers may include the self-employed, borrowers with substantial assets but limited income, jumbo loan borrowers, and investors.
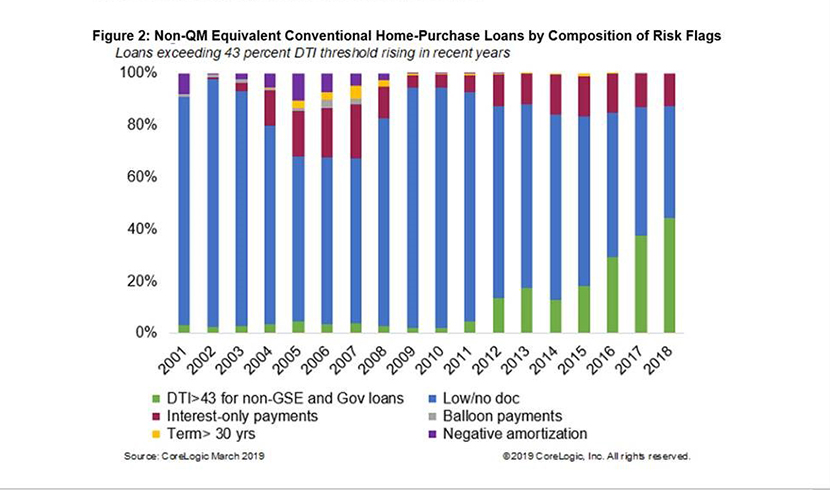
Figure 2: Non-QM Equivalent Conventional Home-Purchase Loans by Composition of Risk Flags
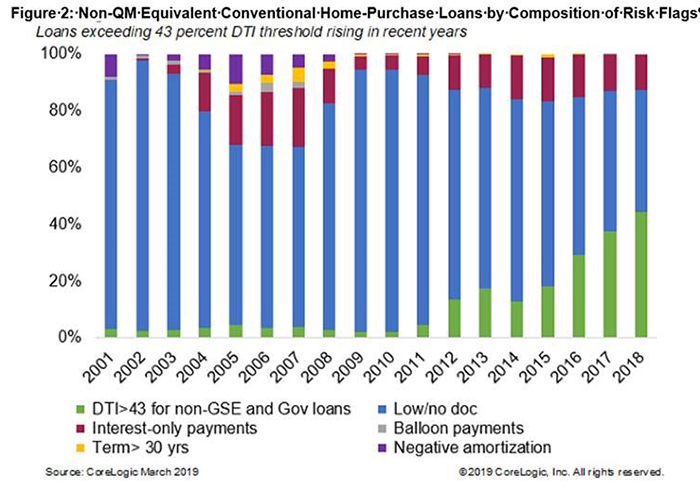
Figure 2 compares the non-QM equivalent loans from 2001 to 2018 by composition of six key risk features. All conventional home-purchase loans not meeting at least one of these six QM-mandated criteria were included. The three common reasons why non-QM loans that originated in 2018 failed to fit in the QM box were use of limited or alternative documentation, debt-to-income (DTI) ratio above 43%, and interest-only loans. Almost 46% of the non-QM borrowers exceeded the 43% DTI threshold, 44% used limited or alternative documentation, and 13% of the non-QMs were interest-only loans. The share of non-QM loans exceeding the 43% DTI threshold has increased by more than three times in 2018 compared with 2014. However, some of the riskier factors such as negative amortization and balloon payments have completely vanished.[10]
Figure 3: Underwriting Trends for First-Lien Home-Purchase Loans, 2001-2018
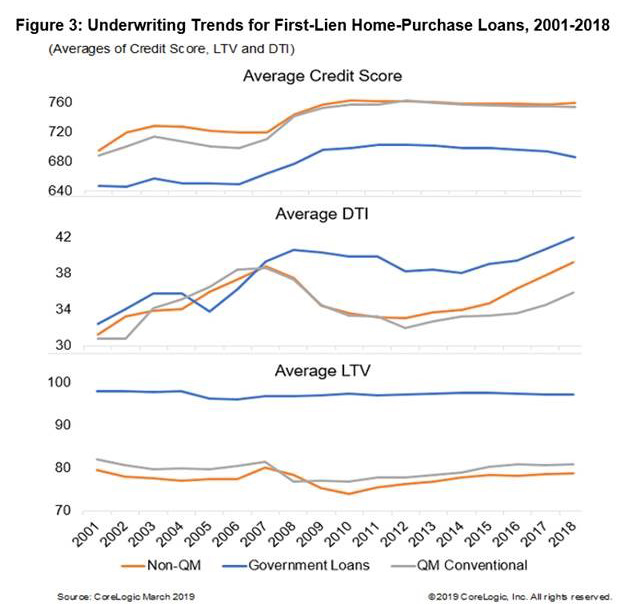
As of 2018, non-QM loans have been associated with high credit quality as measured by the original credit score and loan-to-value (LTV) ratio. Figure 3 illustrates the trend of three major categories of underwriting for first-lien home-purchase loans: credit score, DTI ratio, and LTV) ratio. In 2018, the average credit score of home buyers with non-QMs was 760, compared to a score of 754 for home buyers with QMs. Similarly, the average first-lien LTV for borrowers with non-QMs was 79% compared to 81% for borrowers with QMs. However, the average DTI for home buyers with non-QMs was higher compared with the DTI for borrowers with QMs. Despite having higher DTI ratios than conventional QM loans, non-QMs have been performing very well. Lenders are using high credit score and low LTV to help offset the added risk from high DTI, limited documentation, and interest-only non-QM loans.[11]
Figure 4: The Growth of Non-QM Securitizations
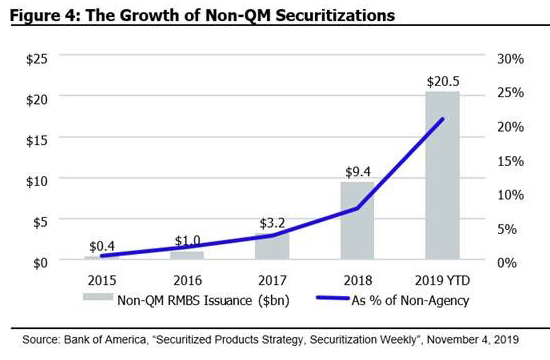
Source: Bank of America, “Securitized Products Strategy, Securitization Weekly”, November 4, 2019
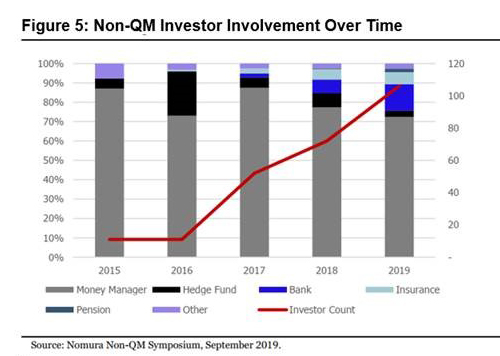
Since 2015, there has been a broad expansion of the number and variety of lenders investing in non-QM deals. According to Nomura, in 2019 there were almost 100 different investors in non-QM securitization deals, compared with just over 70 in 2018 and 50 in 2017.[12] Further, there has been notable growth in the amount of lending by banks, insurance companies, and pension funds.
Figure 5: Non-QM Investor Involvement Over Time
As of November 2019, lenders have packaged more than $18 billion in non-QM loans into bonds this year and sold them to investors, according to a Bloomberg report.[13] That’s a 44% increase from 2018 and the most for any year since the first non-QM securities were issued after the financial crisis. It’s evident that the increased risk tolerance for non-QM loans is being driven by lenders’ desire to capture as much market demand as they can in a favorable rate environment.
With the surge of issuance of non-QM bonds, initial indications of the delinquency rates have started to emerge, and they’re much higher than rates for agency loans. For some non-QM bonds, the delinquency rate is 3% to 5%, compared to the current 0.7% delinquency rate on Fannie Mae loans.[14] Despite the higher level of delinquency rates on these transactions, their newfound popularity does reflect the growing risk that yield-starved investors are taking to boost returns at a time when the U.S. economy is slowing.
Non-QM loans are often considered riskier than their QM counterparts, but not as risky as subprime loans. The current overall level of risk tolerance for non-QM loans is still nowhere near the depths we saw before the last housing crisis.”[15]“It’s not the subprime we remember from 2006 to 2007,” said Mario Rivera, Managing Director of the Fortress Credit Funds business, which has bought non-QM bonds. “It’s more of a second or third inning of non-QM. We’re getting the best collateral before the more aggressive lending comes in.”[16]
Nonetheless, major investors remain skeptical of their protections from R&W when buying loans from lenders with potentially limited repurchasing ability. There is some amount of standardization in the area of a mortgage-backed security (MBS) that is backed by prime-quality QM loans. That standardization has not reached the non-QM segment. The framework for reviewing loans, making repurchase claims, and enforcing claims that has become prevalent for MBS backed by prime-quality QM loans is generally not present or is not fully present in deals backed by non-QM loans. There are not standard triggers for reviews in the non-QM space. Two factors that partly compensate for weaknesses in the non-QM R&W framework are risk retention and 100% pre-closing reviews of the loans in a deal.[17]
In addition to representation and warranty issues, investors are focusing on counterparty risk and liquidity risk. Breach reporting quality has been very inconsistent and not very transparent. The industry needs to worry that, in a weaker credit environment, the lack of consistency and transparency could become real problems.[18]
As the credit box continues to expand, an unrestrained hunger for risk could very well lead us down a destructive path. In the next few years, for example, a change in the political landscape or trade policies could trigger a slowdown in the U.S. economy, which could lead to job layoffs. Merge that with a scenario with over-appreciated home values, and there could be another perfect storm of events that place everybody at risk, especially banks and servicers with large numbers of high-LTV loans on their books.[19]
As lenders decide to take advantage of the opportunity of the surging non-QM market, it is crucial it is to keep in mind that, the more the credit box is expanded to make up for lost production, the more risk they will incur, particularly potential R&W repurchase liability in the event of compliance issues or underwriting defects.
Risk management tools for non-QM lenders
As the non-QM market continues to rapidly grow, R&W risk could be considered one of the main concerns of non-QM issuers. According to Non-QMLoans.com, 22% of surveyed lenders listed R&W risk as a major limitation to participating in non-QM issuance.[20] For non-QM loans, the quality control process for investors is extensive. Some firms will review every single loan in a transaction. It can be very expensive for the issuer to have loans repurchased due to breaches in the underwriting process. Unexpected or unplanned increases in R&W exposure can be a drain on a firm’s capital. Similar lessons learned from the pre-QM era of R&W apply in the non-QM market.
Managing R&W risk can take several forms. Some managers have opted to use actuarially sound reserves to account for R&W risk by setting capital aside on an expected basis for each mortgage issued. These reserve estimates are often done internally or with the assistance of outside actuarial firms.
Other lenders choose the utility of purchasing insurance against the repurchase or indemnity risk. R&W risk insurance provides protection to lenders and issuers against losses for breaches of R&W resulting from a repurchase request by investors. A reserve held by a lender to protect its net worth during a repurchase is a 1:1 ratio: every dollar of the balance of the loan is paid to the investor for loans repurchased. Under a R&W repurchase insurance policy, the ratio could be closer to 1:10.
In response to the growth of non-QM loans, more lenders recently are modifying their risk management strategies by implementing combinations of both tools above. Lenders are allocating a percentage of capital from reserve release toward repurchase insurance to prevent any increases in loan loss exposure. In fact, with R&W insurance lenders are able to increase their reductions of reserves without increasing exposure to repurchase.
A well-designed program that fits the needs of the loan issuers can add tremendous value to a non-QM issuing firm. The costs and benefits of such a program should be integrated in the broader enterprise risk management initiatives of the firm. As noted above, the funds released from the favorable development of the R&W reserves from QM loans with the GSEs can be allocated, in part, to mitigating the inevitable risk that will ensue from the expansion of the non-QM market.
[1] Mortgage Media (July 19, 2019). Components of Cost to Originate Retail Production – MBA Chart of the Week. Retrieved February 12, 2020, from https://www.mortgagemedia.com/mba/chart-of-the-week/components-of-cost-to-originate-retail-production-mba-chart-of-the-week.
[2] GSE data is the publicly available Single Family Loan-Level data sets combined from Fannie Mae (see http://www.fanniemae.com/portal/funding-the-market/data/loan-performance-data.html) and Freddie Mac (see http://www.freddiemac.com/research/datasets/sf_loanlevel_dataset.html).
[3] Togbey, E. & Hannah, J. (January 2, 2018). Is It Time for a Repurchase Reserve Release? MBA Insights. Retrieved February 12, 2020, from https://www.mba.org/publications/insights/archive/mba-insights-archive/2017/is-it-time-for-a-repurchase-reserve-release.
[4] Nomura Securitized Product Research, as of December 31, 2018. Total origination actuals and forecasts from the Mortgage Bankers Association through November 20, 2019.
[5] Ibid.
[6] Inside Mortgage Finance. Mortgage Originations by Product data through 2Q 2019.
[7] Nomura Securitized Product Research, as of December 31, 2018.
[8] Inside Mortgage Finance. Guide to Non-Qualified Mortgages, 2nd Edition.
[9] Pradhan, A. (March 18, 2019). Characteristics of Today’s Non-Qualified Mortgages. CoreLogic Insights Blog. Retrieved February 12, 2020, from https://www.corelogic.com/blog/2019/03/characteristics-of-todays-non-qualified-mortgages.aspx.
[10] Ibid.
[11] Ibid.
[12] Nomura Non-QM Symposium (September 2019).
[13] Boston, C. (November 4, 2019). Risky mortgage bonds are back and delinquencies are piling up. Bloomberg. Retrieved February 12, 2020, from https://www.bloomberg.com/news/articles/2019-11-04/risky-mortgage-bonds-are-back-and-delinquencies-are-piling-up.
[14] Ibid.
[15] Albanese, M. (October 24, 2019). Risk and reward in the non-QM market. MReport. Retrieved February 12, 2020, from https://themreport.com/daily-dose/10-24-2019/risk-and-reward-in-the-non-qm-market/print/.
[16] Risky Mortgage Bonds Are Back and Delinquencies Are Piling Up, op cit.
[17] Adelson, M. (2020). ABS East Conference Notes. Journal of Structured Finance. Retrieved February 12, 2020, from https://jsf.pm-research.com/content/early/2019/11/11/jsf.2019.1.089.
[18] Ibid.
[19] Risk and reward in the non-QM Market, op cit.
[20] NonQMLoans.com (February 14, 2019). Non-QM poised for 400% growth in 2019. Retrieved February 12, 2020, from https://www.nonqmloans.com/non-qm-poised-for-400-growth-in-2019/.
(Views expressed in this article do not necessarily reflect policy of the Mortgage Bankers Association, nor do they connote an MBA endorsement of a specific company, product or service. MBA NewsLink welcomes your submissions. Inquiries can be sent to Mike Sorohan, editor, at msorohan@mba.org; or Michael Tucker, editorial manager, at mtucker@mba.org.)