MBA Chart of the Week: Mobility Rates and Reasons for Moving
This week’s MBA Chart of the Week examines the reasons why fewer Americans are moving.
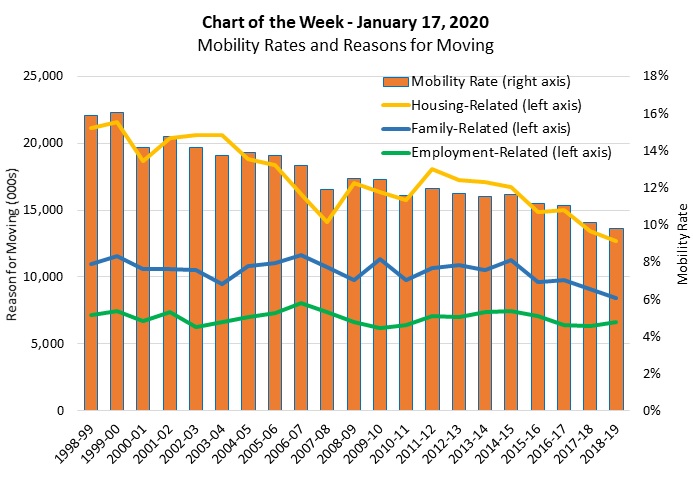
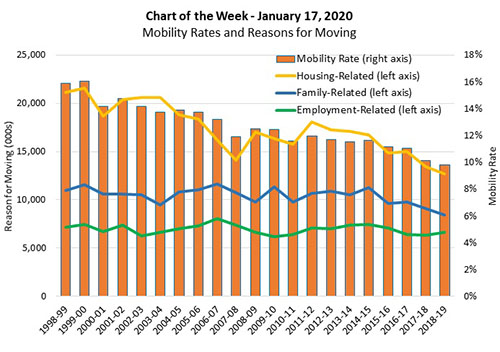
The U.S. mobility rate, defined as the number of movers as a percentage of the population, has steadily declined since the mid-1980s, and the most recent U.S. Census Bureau data show that less than 10 percent of the population moved residence in 2018-19. This is less than half the mobility rate (of 20 percent) in 1984-85.
Since 1999, Census has published the reasons for moving, with a focus on family-related, employment-related and housing-related reasons.
Moves for employment-related reasons have fluctuated over the past 20 years, but they have remained around seven million per annum. Moves for family-related reasons have fallen in the past five years from more than 11 million in 2014 to fewer than nine million. However, the biggest declines are evident for housing-related reasons. These have fallen by nearly nine million from the start of the millennium to 12.6 million today.
From 1998-2004, more than 7.8 million movers (per year) said the reason they moved was because they “wanted a new or better home/apartment,” whereas 5.3 million movers gave this reason in the past two years (on average). Similarly, “wanting to own a home and not rent” accounted for four million moves (on average) from 1998-2004 versus fewer than two million in 2018-19.
(Edward Seiler is Associate Vice President of Housing Economics with the Mortgage Bankers Association and Executive Director of Research Institute for Housing America. He can be reached at eseiler@mba.org.)