MBA Chart of the Week: Refinance Applications by Loan Size

We saw a downward turn in mortgage rates in late 2018, which started when there was a flight to quality in response to concerns about a slowdown in the global economy and trade tensions between the U.S. and China. The drop in mortgage rates led to a revival in the refinance market in 2019.
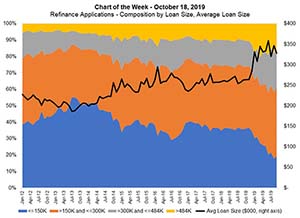
This week’s chart shows the resulting increase in the average loan size for refinance applications, as well as the share of refinance applications broken down into loan size categories.
The first significant drop in mortgage rates was in December 2018–a decrease of 24 basis points to 4.9 percent, and as a result, the average refinance loan amount increased more than $20,000 to $284,000. More recently, the contract rate has slid to below 4 percent, and the average loan size has continued to rise, peaking at $358,700 in June, and averaging $334,000 year-to-date ($264,000 in 2018).
As shown in the chart, the share of refinances in the higher loan size categories (loans over $300,000) have seen the most growth and now make up almost one-third of refinances. Meanwhile, the lowest loan size tier was 36 percent of refinance applications last year but has dropped to 20 percent in 2019.
Why is this happening? Borrowers with larger loan sizes are typically more sensitive to rate changes. Given the fixed costs of a refinance, homeowners with larger loans can realize larger dollar savings by refinancing. Furthermore, the jump is also due to the fact that tight credit standards on jumbo loans may have kept a number of homeowners from refinancing during prior waves of activity following the Great Recession.
(Joel Kan is associate vice president of economic and industry forecasting with MBA; he can be reached at jkan@mba.org.)