MBA Chart of the Week: Thanksgiving Consumption

Source: Bureau of Labor Statistics.
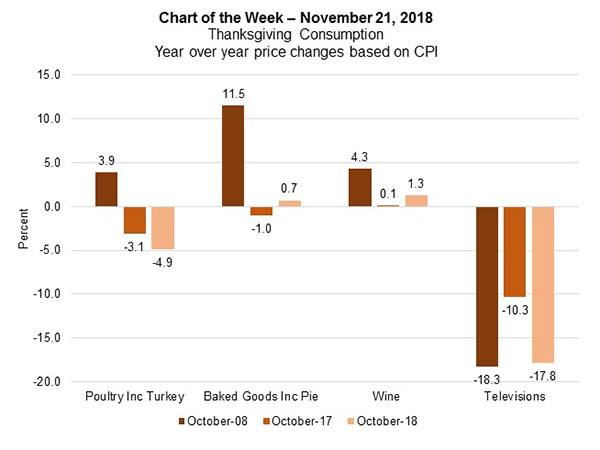
In the spirit of Thanksgiving, we looked at the annual price changes of some popular items typically purchased by consumers during Thanksgiving week, using data from the Consumer Price Index.
We looked at price changes for October in 2008, 2017 and 2018. Televisions were included–those seem to be a popular Black Friday purchase by many households in recent years.
As shown in the chart, poultry prices, including turkey, were down almost 5 percent last month, a steeper drop than a 3.1 percent decrease in 2017. Turkey prices have actually fallen every year since 2015. However, pie and wine prices were up slightly over the year and saw greater increases than in 2017. Wine prices have increased for each of the past 12 months. Television prices fell almost 18 percent over the year and have fallen every year since 1994. Headline inflation for all goods increased 2.5 percent in October 2018 as a matter of comparison.
Our forecast is for overall inflation to stay around 2.5 percent for 2018 and 2019 before coming down to the 2 percent range in 2020, as economic growth slows and the labor market cools.
(Joel Kan is associate vice president of economic and industry forecasting with MBA; he can be reached at jkan@mba.org.)
