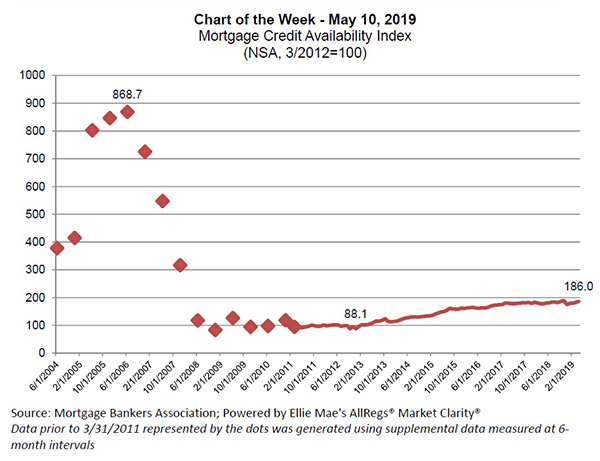
MBA Chart of the Week: Mortgage Credit Availability Index

Source: Mortgage Bankers Association; Powered by Ellie Mae’s AllRegs Market Clarity®. Data prior to 3/31/2011 represented by the dots was generated using supplemental data measured at 6-month intervals.
The supply of mortgage credit continues to grow, as measured by MBA’s Mortgage Credit Availability Index, which is a measure of both the risk and quantity of loan programs that wholesale and broker investors are willing to purchase.
This week’s chart shows overall credit supply in April increased by 2.1 percent from March and was 4.6 percent higher than a year ago. The gains seen compared to last year were mainly driven by growth in the supply of conventional credit. Within the conventional category, the appetite for jumbo programs grew 28 percent from a year ago. Meanwhile, government credit availability has tightened over the past year, decreasing seven percent, mainly due to policy changes that ended up reducing the number of streamline refinance programs.
Overall, credit availability has more than doubled since late 2012, when the regulatory landscape was extremely restrictive and lenders had scaled back their offerings. However, the index is still one-fifth of where it was at the height of the market in mid-2006, and about half of the pre-boom levels of 2004.
Looking ahead, we expect credit availability to continue to grow, which will help potential homeowners in this competitive purchase market, where overall economic and job market conditions are healthy. Home-price growth is moderating and slowly getting closer in line to wage growth, and mortgage rates are low compared to decades past.
(Joel Kan is associate vice president of economic and industry forecasting with MBA; he can be reached at jkan@mba.org.)
