MBA Chart of the Week: Ratio of Unemployed Workers Per Job Opening
Source: Bureau of Labor Statistics.
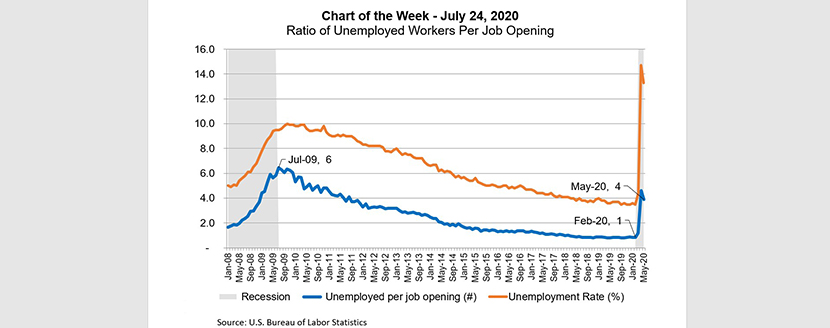
This week’s MBA Chart of the Week uses data from the U.S. Bureau of Labor Statistics to look at the ratio of the number of unemployed workers to job openings to highlight how the current recession is different than the recession in 2007-2009.
In the previous recession, the measure peaked at 6 workers per opening, with the unemployment rate reached almost 10 percent. In May 2020, this measure was at 4 workers per opening, with unemployment considerably higher at 13 percent. Before the COVID-19 pandemic hit, the ratio was just under 1 worker per opening.
Despite the acute increase in unemployed workers this April and May – which reached more than 20 million compared to the almost 15 million in 2009 – the current ratio is lower because there are more job openings during this episode (an average of 5.5 million from March-to-May) than in 2009 (an average of 3.5 million).
However, the current pandemic-induced shock to employment has hit the workforce disproportionately, with sectors such as leisure and hospitality affected more than other sectors. Leisure and hospitality lost 47 percent of its payroll employment in April alone, and even following 16 and 21 percent increases in May and June respectively, employment remains almost 30 percent below pre-pandemic levels – a shortfall of more than 4 million workers.
Improvements in the public health situation are the key driver for an economic recovery. However, time is of the essence. In June, there were 10.6 million people classified as temporarily unemployed. The longer they remain out of work, the greater the risk that these temporary layoffs become permanent. We hope for and expect improvement in job market conditions, as this will help keep renters paying, keep homeowners current on their mortgage payments, while also giving households confidence to consider purchasing a home.
–Joel Kan jkan@mba.org