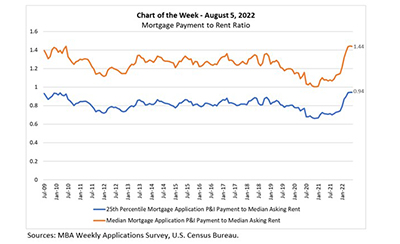
This MBA Chart of the Week examines the relationship between mortgage payments and asking rents since the second half of 2009. MBA’s national mortgage payment to rent ratio compares the national median and 25th percentile mortgage payments to the national median asking rent.
Tag: MBA Chart of the Week
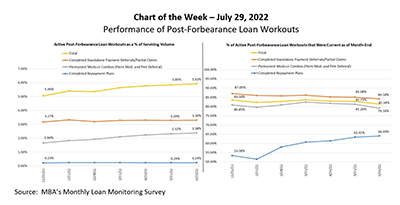
MBA Chart of the Week: Performance of Post-Forbearance Loan Workouts
According to MBA’s Monthly Loan Monitoring Survey, the share of loans in forbearance dropped slightly to 0.81 percent of servicers’ portfolio volume as of June 30, from 0.85 percent the prior month. Only about 404,000 homeowners are still in forbearance plans, after reaching a peak of nearly 4.3 million homeowners in May 2020.
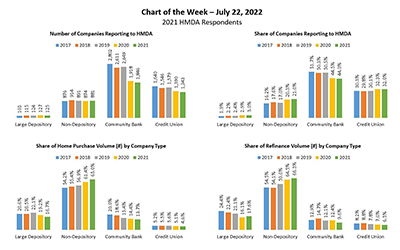
MBA Chart of the Week: 2021 HMDA Respondents
A total of 4,195 companies reported lending activity under the Home Mortgage Disclosure Act in 2021, according to MBA’s own analyses of the dataset. Company types are defined by primary regulator and balance sheet assets, with large depositories holding assets of $10 billion or more.
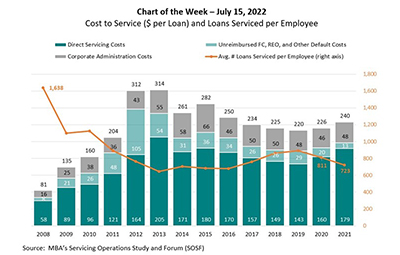
MBA Chart of the Week July 15 2022: Cost to Service Loans Per Employee
MBA’s annual Servicing Operations Study and Forum includes a deep-dive analysis and discussion of servicing costs, productivity, portfolio activity and operational metrics for in‐house servicers.
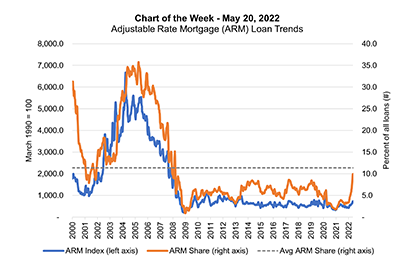
MBA Chart of the Week May 20, 2022: ARM Loan Trends
The recent increase in the adjustable-rate mortgage share of applications has caught the attention of market participants and the media. The ARM share has increased from 3.1 percent in the first week of January to 10.3 percent as of the week ending May 13, peaking at 10.8 percent the week prior.
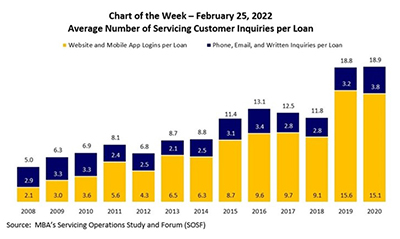
MBA Chart of the Week: Servicing Customer Inquiries Per Loan
In this week’s MBA Chart of the Week, we focus on borrower communications, specifically the average number of annual servicing customer inquiries per loan. MBA has tracked this data through its Servicing Operations Study and Forum since 2008.
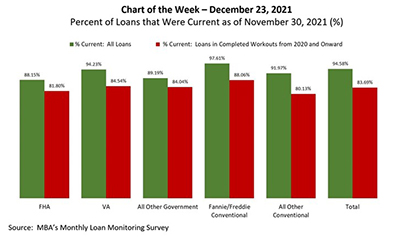
MBA Chart of the Week Dec. 23 2021: Percent of Current Loans
According to the MBA Monthly Loan Monitoring Survey, the share of loans in forbearance dropped to 1.67 percent of servicers’ portfolio volume as of November 30, after climbing to a monthly peak of 8.53 percent as of May 31, 2020. As many borrowers have moved out of forbearance and into permanent loan workout solutions since 2020, the question becomes: How are they faring?
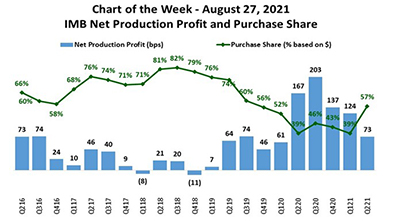
MBA Chart of the Week Aug. 30 2021: IMB Net Production Profit & Purchase Share
In this week’s MBA Chart of the Week, we look at net production profit in basis points, relative to the purchase share of total first mortgage originations by dollar volume over a five-year time span – second quarter 2016 through second quarter 2021.
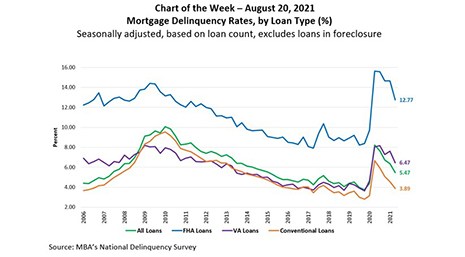
MBA Chart of the Week Aug. 23 2021: Mortgage Delinquency Rates, by Loan Type (%)
This week’s MBA Chart of the Week takes a look at mortgage delinquency rates by loan type (%) since 2006.
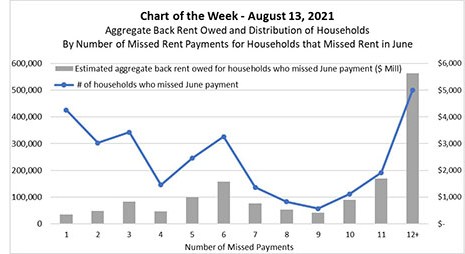
MBA Chart of the Week Aug. 16 2021–Aggregate Back Rent Owed
This week’s MBA Chart of the Week zeroes in on households who missed rental payments in June. The chart plots a) the distribution of those households by the number of payments they have missed since the onset of the pandemic; and b) an estimate of the aggregate dollar volume of back rent owed by those households.

