U.S. Population Growth Continues to Slow
Data released by the U.S. Census Bureau shows 42 states and the District of Columbia had fewer births in 2019 than 2018, while eight states saw a birth increase. With fewer births in recent years and the number of deaths increasing, natural increase (or births minus deaths) has declined steadily over the past decade.
“While natural increase is the biggest contributor to the U.S. population increase, it has been slowing over the last five years,” said Sandra Johnson, a demographer/statistician in the Population Division of the Census Bureau. “Natural increase, or when the number of births is greater than the number of deaths, dropped below 1 million in 2019 for the first time in decades.”
Census said the U.S. population stood at 328,239,523 in 2019, growing by 0.5% between 2018 and 2019, or 1,552,022 people. Annual growth peaked at 0.73% this decade in the period between 2014 and 2015. Johnson said the growth between 2018 and 2019 is a continuation of a multiyear slowdown since that period.
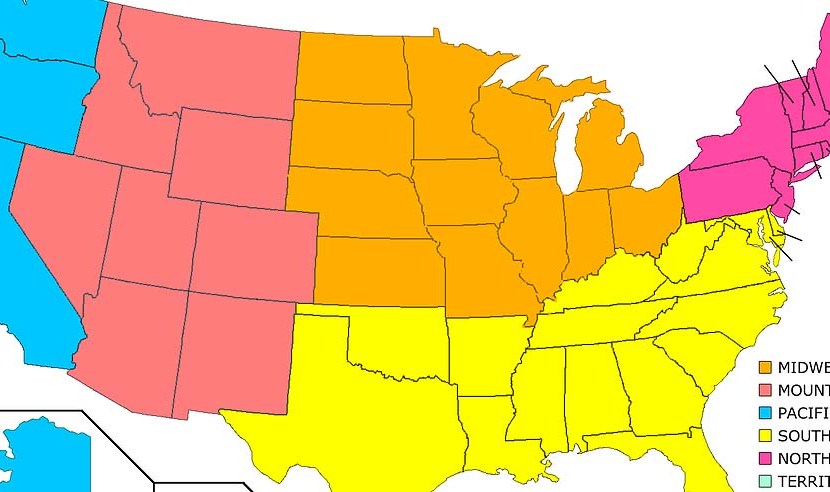
The South, the largest of the four regions with a population of 125,580,448 in 2019, saw the largest numeric growth (1,011,015) and percentage growth (0.8%) between 2018 and 2019. This growth is driven mainly by natural increase (359,114) and net domestic migration (407,913)–the movement of people from one area to another within the United States.
The Northeast region, the smallest of the four regions with a population of 55,982,803 in 2019, saw population decrease for the first time this decade, declining by 63,817 or -0.1%. This decline was due to net domestic migration (-294,331), which offset population gains from natural increase (97,152) and net international migration (134,145), or the difference between the number of people moving into the country and out of the country.
Forty states and the District of Columbia saw population increases between 2018 and 2019. Ten states lost population between 2018 and 2019, four of which had losses of more than 10,000 people. The 10 states that lost population were New York (-76,790; -0.4%), Illinois (-51,250; -0.4%), West Virginia (-12,144; -0.7%), Louisiana (-10,896; -0.2%), Connecticut (-6,233; -0.2%), Mississippi (-4,871; -0.2%), Hawaii (-4,721; -0.3%), New Jersey (-3,835; 0.0%), Alaska (-3,594; -0.5%), and Vermont (-369 ; -0.1%).
Puerto Rico’s population increased by just 340 people between 2018 and 2019 after several years of annual population decline. This slight increase is due to total net migration, which was positive for the first time in years (7,733) and large enough to offset the natural decrease (-7,393). “Though migration between 2018 and 2019 was large enough to increase the population this year, Puerto Rico’s population remains below where it was at the start of the decade,” Johnson said.
Other key data:
–Nationally, net international migration continues to decrease, falling to 595,348 between 2018 and 2019. Between 2010 and 2019, the year with the highest net international migration was 2016 at 1,046,709; however, since 2016, the net international migration has been gradually decreasing each year.
–Between 2018 and 2019, natural increase was 956,674, reflecting 3,791,712 births and 2,835,038 deaths.
–42 states and the District of Columbia had fewer births in 2019 than 2018. Eight states saw increases in births – Washington (612), Utah (293), Nevada (232), Arizona (175), Idaho (166), Montana (66), Vermont (44) and Colorado (30).
–Twenty-four states and the District of Columbia saw increases in their number of deaths compared to the previous year. Four states had more deaths than births, also called natural decrease: West Virginia (-4,679), Maine (-2,262), New Hampshire (-121) and Vermont (-53).
–Twenty-seven states and the District of Columbia lost population through net domestic migration between 2018 and 2019, six of which had losses over 25,000, and three of which experienced losses greater than 100,000. The top states with net domestic migration loss were California (-203,414), New York (-180,649), Illinois (-104,986), New Jersey (-48,946), Massachusetts (-30,274) and Louisiana (-26,045).
–Nine states had a population of over 10 million in 2019. Those states were California (39,512,223), Texas (28,995,881), Florida (21,477,737), New York (19,453,561), Pennsylvania (12,801,989), Illinois (12,671,821), Ohio (11,689,100), Georgia (10,617,423) and North Carolina (10,488,084).
These demographic shifts will likely have noticeable impacts on the political landscape as well. Analysts said California—which as noted above lost more than 203,000 people through net domestic migration between 2018 and 2019—could lose a congressional seat for the first time in its history, dropping from 53 to 52. Other states slated to lose congressional seats include Michigan, Ohio, Pennsylvania, Illinois, Minnesota, New York and Rhode Island.
On the flip side, Texas stands to gain three new congressional seats, while Florida would pick up two. Other states slated to gain seats are Arizona, Montana and North Carolina.