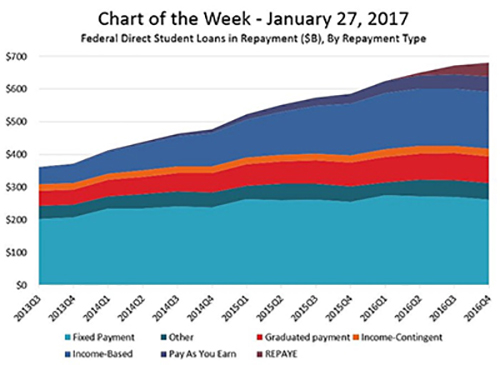
MBA Chart of the Week: Federal Direct Student Loans in Repayment ($B), By Repayment Type

Source: Office of Federal Student Aid; Mortgage Bankers Association.
While the first-time homebuyer share of home sales has increased, it is still below typical levels, and many point to student debt as one obstacle for potential buyers.
Since 2010, direct lending by the federal government has dominated student loan originations. This week’s chart shows the outstanding amount of student loans funded directly by the federal government (with the exception of Perkins grants) that are in repayment, deferment and forbearance at the end of each fiscal quarter, by type of repayment plan.
Programs with fixed payments for the life of the loan accounted for more than 55 percent of all direct Federal loans in repayment in 2013 but fell to a share of less than 40 percent by the end of the 2016 fiscal year.
There are a variety of other repayment plans which are becoming increasingly popular (additional data and some definitions are available at https://studentaid.ed.gov/sa/about/data-center/student/portfolio). The variety of plans may make it difficult for mortgage lenders to underwrite the monthly debt obligations of applicants with student loans because the size of loan payments (and the potential for eventual loan forgiveness) may be conditional on future actions and employment of borrowers.
Given the complexity and uncertainty of underwriting mortgages, coupled with pressure to meet strict regulatory guidelines, lender and investor policies with respect to student loans can serve to limit access to mortgage credit.
(Lynn Fisher is vice president of research and economics with MBA; she can be reached at lfisher@mba.org. Joel Kan associate vice president of economic forecasting with MBA; he can be reached at jkan@mortgagebankers.org.)
