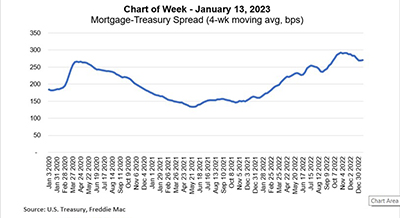
This week’s MBA Chart of the Week examines the spread between the 30-year fixed mortgage rate and 10-year Treasury yield.
Tag: U.S. Treasury Yields

MBA Chart of the Week Jan. 13, 2023: Mortgage-Treasury Spread
This week’s MBA Chart of the Week looks at the spread of mortgage rates relative to Treasury yields. This has been one of the more puzzling aspects of the current environment and a contributor to the rapid rise in mortgage rates over the past year.

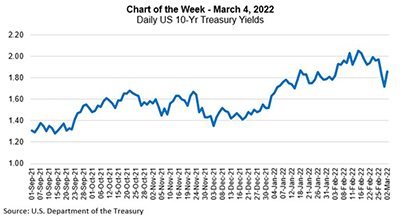
MBA Chart of the Week, Mar. 4, 2022: 10-Year U.S. Treasury Yields
Prior to Russia’s invasion, 10-Year Treasury yields broke higher — reaching 2.05% on February 15. Since then, they have fallen to as low as 1.72% but have rebounded somewhat, underscoring both the downside risk and volatility markets are facing.

