Interest rates rose again last week—but instead of dampening mortgage application activity, borrowers responded with across-the board increases, Mortgage Bankers Association reported Wednesday in its Weekly Mortgage Applications Survey for the week ending Mar. 3.
Tag: Joel Kan

MBA Weekly Survey Mar. 1, 2023: Rising Rates Push Down Mortgage Applications
Interest rates reached their highest level since November, driving down mortgage application activity, the Mortgage Bankers Association reported Wednesday in its Weekly Mortgage Applications Survey for the week ending February 24.
MBA Weekly Survey Feb. 22, 2023: Mortgage Applications Decrease
Mortgage applications decreased 13.3 percent from one week earlier, according to data from the Mortgage Bankers Association’s Weekly Mortgage Applications Survey for the week ending February 17, 2023.
MBA Weekly Survey Feb. 22, 2023: Mortgage Applications Decrease
Mortgage applications decreased 13.3 percent from one week earlier, according to data from the Mortgage Bankers Association’s Weekly Mortgage Applications Survey for the week ending February 17, 2023.
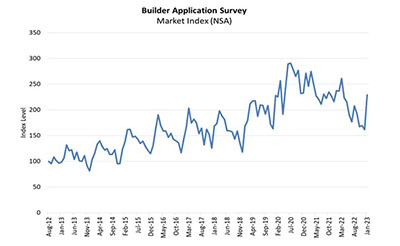
January New Home Purchase Mortgage Applications Up 42%
Mortgage applications for new home purchases in January jumped by 42 percent from December but fell by 3.5 percent from a year ago, the Mortgage Bankers Association reported Friday.
January New Home Purchase Mortgage Applications Up 42%
Mortgage applications for new home purchases in January jumped by 42 percent from December but fell by 3.5 percent from a year ago, the Mortgage Bankers Association reported Friday.
MBA Weekly Survey Feb. 15, 2023: Rising Rates Push Down Applications
After falling for the past five weeks, mortgage interest rates jumped by nearly a quarter percentage point last week, dampening mortgage application activity, the Mortgage Bankers Association reported Wednesday.
MBA Weekly Survey Feb. 15, 2023: Rising Rates Push Down Applications
After falling for the past five weeks, mortgage interest rates jumped by nearly a quarter percentage point last week, dampening mortgage application activity, the Mortgage Bankers Association reported Wednesday.
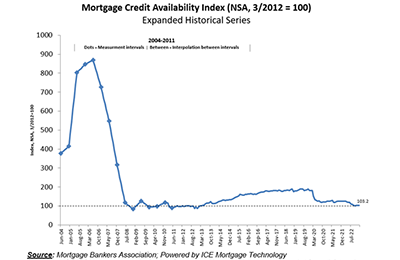
January Mortgage Credit Availability Flat for 2nd Straight Month
Mortgage credit availability fell by just 0.1 percent in January and has held flat for the past two months, the Mortgage Bankers Association reported Thursday.