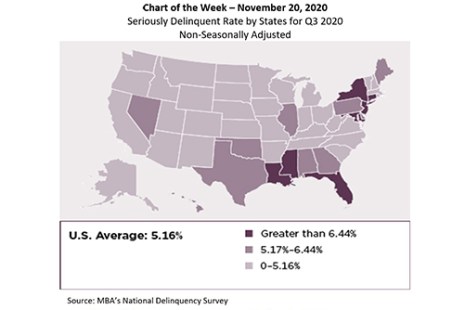
MBA released its National Delinquency Survey results for the third quarter last week. This week’s chart highlights the seriously delinquent rate – the percentage of loans that are 90 days or more delinquent or in the process of foreclosure – in every state across the country.
Tag: Anh Doan
MBA Chart of the Week: Mortgage Delinquency Rates
MBA released its National Delinquency Survey results for the second quarter last week. Key findings revealed that the COVID-19 pandemic’s effects on some homeowners’ ability to make their mortgage payments could not be more apparent.
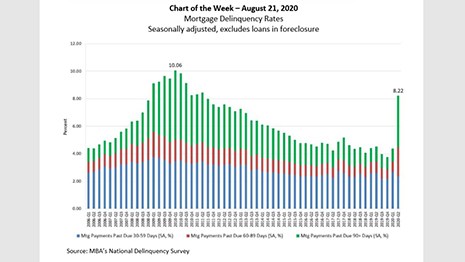
MBA Chart of the Week: Mortgage Delinquency Rates
MBA released its National Delinquency Survey results for the second quarter last week. Key findings revealed that the COVID-19 pandemic’s effects on some homeowners’ ability to make their mortgage payments could not be more apparent.
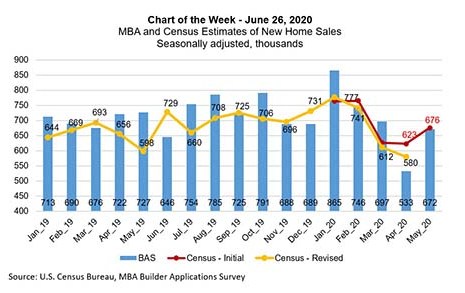
MBA Chart of the Week: MBA, Census Estimates of New Home Sales
This week’s chart shows how the U.S. Census Bureau’s new home sales series has compared to our Builder Applications Survey data from 2019 through May 2020. The BAS has been a reliable leading indicator of Census’ new home sales data.
MBA Chart of the Week: MBA, Census Estimates of New Home Sales
This week’s chart shows how the U.S. Census Bureau’s new home sales series has compared to our Builder Applications Survey data from 2019 through May 2020. The BAS has been a reliable leading indicator of Census’ new home sales data.
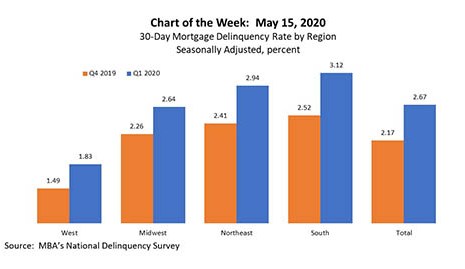
MBA Chart of the Week: 30-Day Mortgage Delinquency Rate by Region
MBA released its latest National Delinquency Survey for first quarter 2020 earlier this week. At the end of the first quarter, the delinquency rate for mortgage loans on one-to-four-unit residential properties jumped by 59 basis points to a seasonally adjusted rate of 4.36 percent of all loans outstanding.
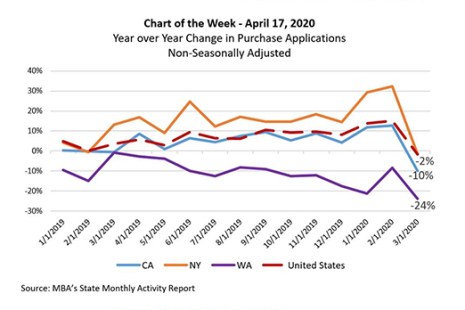
MBA Chart of the Week: Year over Year Change in Purchase Applications
According to data from MBA’s State Monthly Activity Report (SMAR), purchase applications grew for 14 consecutive months until the impacts of COVID-19 slowed activity to a 2 percent decline in March. Most of the decline was likely in the last two weeks of the month, when many states enacted restrictions on non-essential business and social activity.

MBA Chart of the Week: Estimates of New Home Sales
Want to get an early read of the U.S. Census Bureau’s monthly release of new home sales? Start following MBA’s estimates on new home sales in the monthly release of the Builder Application Survey.