Affordability Improves for Second Month, but Home Buyers Shrug–First American’s Mark Fleming
Mark Fleming is chief economist at First American, Santa Ana, Calif.
Nationally, affordability improved on a monthly basis for the second consecutive month in July, driven by lower mortgage rates and positive income growth. However, on an annual basis, affordability remains nearly 2 percent lower than one year ago.
The primary factor contributing to the annualized drop in affordability was a 5.3 percent annual increase in nominal house prices, according to our First American Data & Analytics House Price Index. The 30-year fixed mortgage rate was essentially flat compared to July 2023.
Even though household income increased 3.6 percent since July 2023 and boosted consumer house-buying power, it was not enough to offset the affordability loss from rising nominal prices. Although affordability on a national level remains lower than it was a year ago, there are 12 markets now more affordable than they were a year ago – a first since 2021.
Improving Affordability Not Enough to Boost Buyer Sentiment
Affordability may be improving in more markets, but potential home buyers have long memories and homes everywhere are significantly less affordable than before the pandemic. Modest improvements may not be enough to significantly boost demand, as household incomes remain stretched relative to mortgage payments.
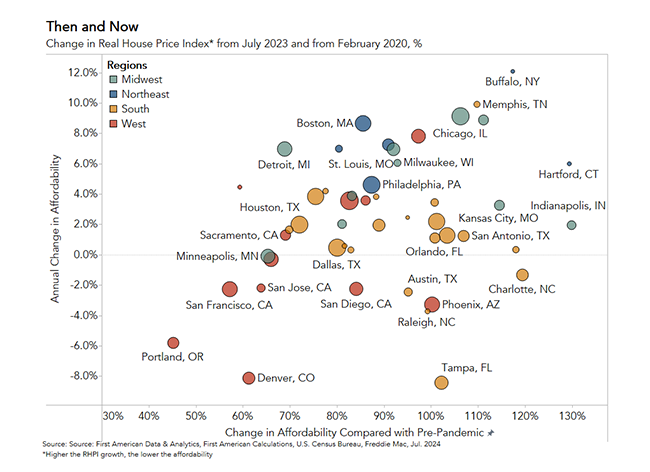
Tampa, Fla. offers a telling example of the dynamic playing out in the housing market. In July, affordability improved the most on an annual basis in Tampa. Yet, despite the progress, affordability in Tampa is down more than 100 percent compared with February 2020 due to a 3.4 percentage point increase in mortgage rates and a nearly 65 percent increase in nominal house prices. The monthly principal and interest on the median-priced existing home in Tampa has increased by nearly 160 percent from $875 to $2,272. Meanwhile, the median household income has only increased by approximately 19 percent since 2020.
The chart below depicts these affordability dynamics across the top markets in the U.S., with higher rates of growth indicating declining affordability, and vice versa. The x-axis represents the change in affordability compared with pre-pandemic levels, while the y-axis is the annual change in affordability. Affordability has declined by more than 40 percent since February 2020 in all markets, with affordability crashing by more than 100 percent in 16 markets.
Markets in the South and West dominate the bottom portion of the chart, indicating improvements in affordability. Markets that have seen improvements in affordability are those with below-average nominal house price growth, either because prices are cooling from unsustainable highs or because prices in traditional more expensive markets are correcting given the higher rate environment. But, even with those improvements, affordability in these markets remains on average 80 percent lower than in February 2020.
While any incremental improvement in affordability is welcome news for potential home buyers, context is important when considering buyer sentiment in today’s market. For example, according to Fannie Mae’s Home Purchase Sentiment Index sentiment decreased 1.1 percentage points in July to 71.5 and only 17 percent of consumers indicated that it’s a good time to buy a home, down from 19 percent in June and 18 percent from one year ago. However, mortgage rates have fallen further in August, which may help stretch the streak of improving affordability into a third month and slowly start to lift buyers’ views on the housing market.
(Views expressed in this article do not necessarily reflect policies of the Mortgage Bankers Association, nor do they connote an MBA endorsement of a specific company, product or service. MBA NewsLink welcomes your submissions. Inquiries can be sent to Editor Michael Tucker or Editorial Manager Anneliese Mahoney.)