April Indexes Show Solid but Mixed Results for Home Prices
(Courtesy FHFA)
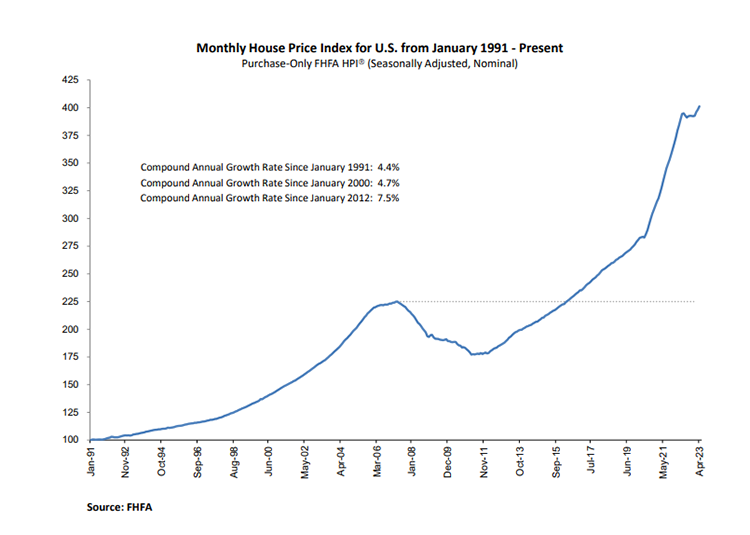
The Federal Housing Finance Agency’s seasonally adjusted House Price Index for April showed a 3.1% increase in home prices year-over-year and a 0.7% increase from March.
However, in slight contrast, S&P Dow Jones Indices, New York, released its S&P CoreLogic Case-Shiller Indices for April, showing a 0.2% year-over-year decrease, but a 1.3% increase from March (or 0.5% when seasonally adjusted.)
“U.S. house prices generally increased moderately in April,” said Nataliya Polkovnichenko, Supervisory Economist in FHFA’s Division of Research and Statistics. “However, on a year-over-year basis, house prices in some regions of the country continued to decline.”
In terms of those regional fluctuations, FHFA reported prices increased just 0.1% in the Pacific division from March, but 2.4% in New England. Year-over-year saw even bigger variations–a fall of 3.8% in the Pacific division but up 6.1% in the East South Central division.
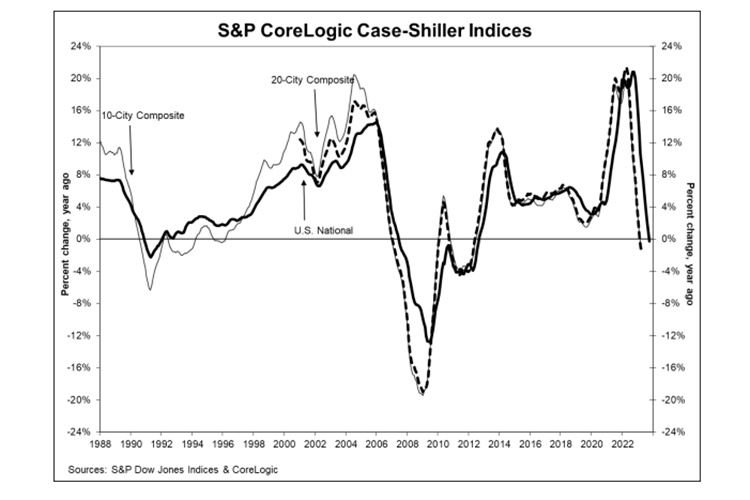
S&P noted the Case-Shiller 10-City Composite showed a year-over-year decrease of 1.2%. The 20-City Composite posted a 1.7% year-over-year loss.
Miami, Chicago and Atlanta reported the highest year-over-year gains among the top 20.
“The U.S. housing market continued to strengthen in April 2023,” said Craig Lazzara, Managing Director at S&P DJI. “Home prices peaked in June 2022, declined until January 2023, and then began to recover. The National Composite rose by 1.3% in April (repeating March’s performance), and now stands only 2.4% below its June 2022 peak.”
“If I were trying to make a case that the decline in home prices that began in June 2022 had definitively ended in January 2023, April’s data would bolster my argument. Whether we see further support for that view in coming months will depend on how well the market navigates the challenges posed by current mortgage rates and the continuing possibility of economic weakness,” Lazzara noted.