MBA Chart of the Week July 3, 2023: Office Property Sales Volumes and Values
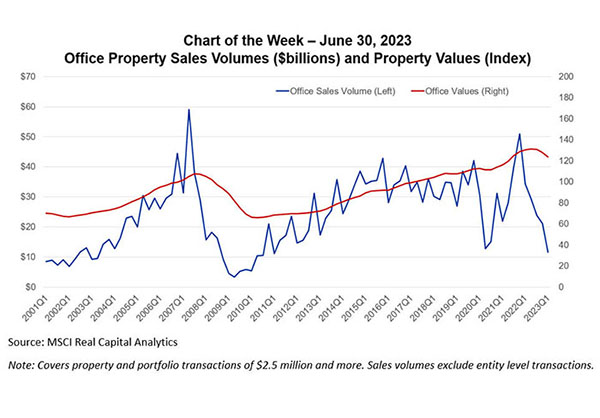
Source: MSCI Real Capital Analytics
Note: Covers property and portfolio transactions of $2.5 million and more. Sales volumes exclude entity level transactions.
In commercial real estate, all eyes remain on the office market. That is despite the fact that multifamily mortgage debt – accounting for $2.0 trillion of the $4.6 trillion of total outstanding — is almost three times as large and office accounts for just 17 percent of total CRE debt.
But office is the property type that is going through the greatest reset. Data from MSCI Real Capital Analytics shows the dollar volume of office properties sold during the first quarter of 2023 was 66 percent lower than a year earlier. Originations of mortgages backed by office properties were down 67 percent over the same period. In a sign of the lag occurring in pricing data, series tracking office property values show just a nine percent decline from recent peaks – a clear understatement.
Last September, we released a white paper looking into the question of why we office in the first place and what that might tell us about future demand. In the intervening nine months, a great deal of uncertainty has remained, but we are starting to see clearer signals of where things may be headed.
One closely watched gauge, Kastle System’s record of employee “swipes” to enter offices, shows office usage at roughly half of pre-pandemic levels but with significant variation by day (ranging from 33 percent of pre-pandemic levels on Fridays to 60 percent on Tuesdays) and market (with San Jose at 45 percent of pre-pandemic levels on Tuesdays and Chicago and Houston at 69 percent). Some other measures, including cell phone tracking and transit usage, imply a greater level of return to the office.
Changes in, and uncertainty about, office norms have led to a run-up in office vacancies, hitting 19.0 percent in Q1 from 18.1 percent a year earlier according to Moody’s. This generally does not include space available for sublease which can drive that number higher. But other studies point to concentrations in the changes of office usage, with JLL recently reporting that 60 percent of vacancy is concentrated in 10 percent of office buildings, and more than 90 percent of vacancy is concentrated in 30 percent of buildings.
While many of the headlines highlight the hardest-hit properties, market participants appear to be beginning to differentiate between office properties that are being most significantly impacted and those that are not.
Commercial real estate is a vast and varied market – with buildings, and loans, spread across property types, markets, classes, vintages and much, much more. While changes in interest rates, uncertainty about property values and questions about some property fundamentals have led to significant slowdowns in sales and mortgage origination activity in recent quarters, it’s important to remember that not all properties will be affected in the same ways.