MBA: Mortgage Application Payments Increased 2.3% in January to $1,964
Homebuyer affordability declined in January, with the national median payment applied for by purchase applicants increasing 2.3 percent to $1,964 from $1,920 in December 2022, the Mortgage Bankers Association reported.
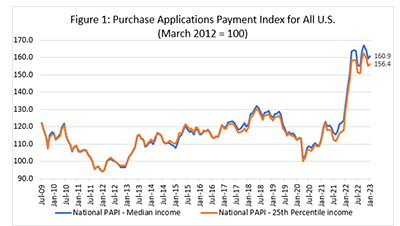
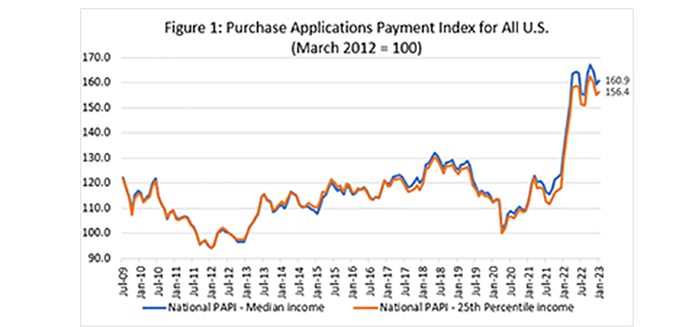
The MBA Purchase Applications Payment Index (PAPI) measures how new monthly mortgage payments vary across time – relative to income – using data from MBA’s Weekly Applications Survey.
“Although interest rates fell 16 basis points from December 2022 to January, homebuyer affordability declined slightly due to the increase in the median purchase application amount, which inched up $12,000 to $312,000,” said Edward Seiler, MBA Associate Vice President of Housing Economics and Executive Director of the Research Institute for Housing America.
Seiler said MBA expects the combination of economic uncertainty, high mortgage rates and persisting affordability challenges to impact purchase demand, “especially at the lower end of the market where supply is still tight.”
An increase in MBA’s PAPI – indicating declining borrower affordability conditions – means the mortgage payment to income ratio is higher due to increasing application loan amounts, rising mortgage rates or a decrease in earnings. A decrease in the PAPI – indicating improving borrower affordability conditions – occurs when loan application amounts decrease, mortgage rates decrease or earnings increase.
The national PAPI (Figure 1) increased 0.9 percent to 160.9 in January from 159.5 in December. Even though there was an increase in the January PAPI, the current PAPI is 6.3 points down from the series high in October 2022. Compared to January 2022 (132.7), the index is up 21.2 percent compared to year-ago levels. For borrowers applying for lower-payment mortgages (the 25th percentile), the national mortgage payment increased to $1,322 in January from $1,279 in December.
The Builders’ Purchase Application Payment Index (BPAPI) showed the median mortgage payment for purchase mortgages from MBA’s Builder Application Survey decreased to $2,379 in January compared to $2,399 in December 2022.
Additional Findings from January:
- The national median mortgage payment was $1,964 in January, up from $1,920 in December but down from $1,977 in November. It is up by $437 from one year ago, equal to a 28.7% increase.
- The national median mortgage payment for FHA loan applicants was $1,619 in January, up from $1,602 in December 2022 and from $1,142 in January 2022.
- The national median mortgage payment for conventional loan applicants was $2,009, up from $1,954 in December 2022 and from $1,582 in January 2022.
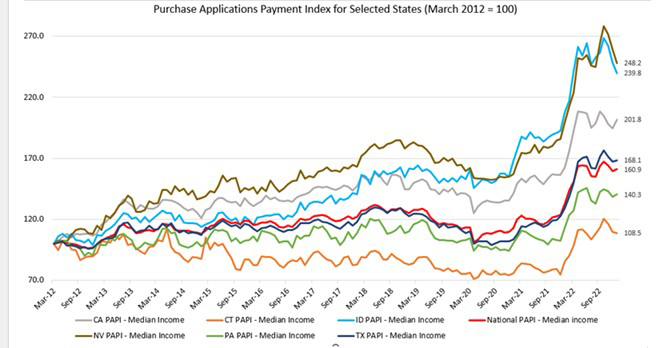
- The top five states with the highest PAPI were: Nevada (248.2), Idaho (239.8), Utah (217.9), Arizona (216.6), and Florida (203.1).
- The top five states with the lowest PAPI were: Washington, D.C. (103.4), North Dakota (107.8), Connecticut (108.5), Arkansas (112.4), and West Virginia (117.8).
- Homebuyer affordability decreased for Black households, with the national PAPI increasing from 159.5 in December to 160.9 in January.
- Homebuyer affordability decreased for Hispanic households, with the national PAPI increasing from 152.5 in December to 153.8 in January.
- Homebuyer affordability decreased for White households, with the national PAPI increasing from 160.6 in December to 162.0 in January.
About MBA’s Purchase Applications Payment Index
The Mortgage Bankers Association’s Purchase Applications Payment Index (PAPI) measures how new mortgage payments vary across time relative to income. Higher index values indicate that the mortgage payment to income ratio is higher than in a month where the index is lower. Contrary to other affordability indexes that make multiple assumptions about mortgage underwriting criteria to estimate mortgage payment level, PAPI directly uses MBA’s Weekly Applications Survey data to calculate mortgage payments.
PAPI uses usual weekly earnings data from the U.S. Bureau of Labor Statistics’ Current Population Survey (CPS). Usual weekly earnings represent full-time wage and salary earnings before taxes and other deductions and include any overtime pay, commissions, or tips usually received. Note that data are not seasonally adjusted.
MBA’s Builders’ Purchase Application Payment Index uses MBA’s Builder Application Survey data to create an index that measures how new mortgage payments vary across time relative to income, with a focus exclusively on newly built single-family homes. As with PAPI, higher index values indicate that the mortgage payment to income ratio is higher than in a month where the index is lower. To create BPAPI, principal and interest payment amounts are deflated by the same earnings series as in PAPI.
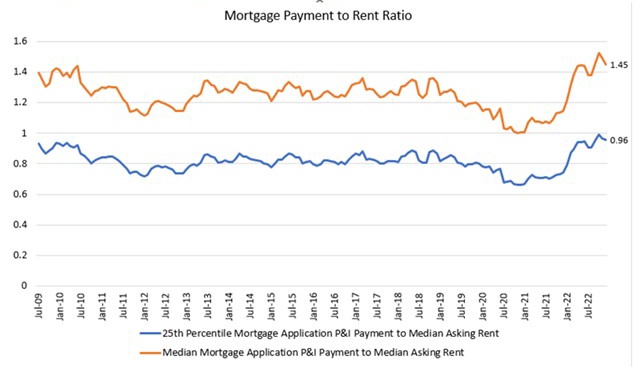
The rent data series calculated for MBA’s national mortgage payment to rent ratio (MPRR) comes from the U.S. Census Bureau’s Housing Vacancies and Homeownership survey’s median asking rent. The HVS data is quarterly, and as such, the mortgage payment to rent ratio will be updated quarterly.
For additional information on MBA’s Purchase Applications Payment Index, click here.