MBA Chart of the Week Oct. 13, 2022: 2021 Housing Stock
At the end of September, HUD and the Census Bureau released 2021 American Housing Survey summary table estimates in the AHS Table Creator and 2021 AHS National and Metro Public Use File microdata.
The AHS, last updated with 2019 data, is the “most comprehensive national housing survey in the United States,” and provides information about the quality and cost of housing, including data on “the physical condition of homes and neighborhoods, the costs of financing and maintaining homes, and the characteristics of people who live in these homes.”

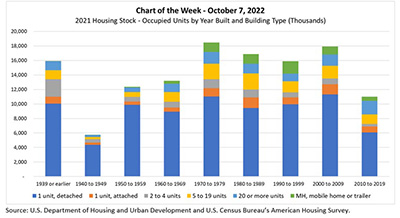
In this week’s MBA Chart of the Week, we show the stock of occupied homes in the U.S. by the decade built and by building type. The chart indicates that the housing stock in the U.S. is aging:
- As of 2021 there were 11.0 million occupied units built in the 2010s. This is less than the 2021 stock of occupied units for any other decade going back to the 1940s and is 39% lower than the stock of occupied homes built in the 2000s (18.0 million).
- The median age of the occupied housing stock was 42 years in 2021. This compares to 41 years in the 2019 AHS, 39 years in the 2015 AHS and 37 years in the 2011 AHS.
The chart also shows that the stock of occupied units by building type has evolved:
- The 2021 stock of 1-4-unit housing units was more than 13.5 million for homes built in the 2000s versus 7.3 million for homes built in the 2010s. That is, the 2021 stock of 1-4-unit single-family homes was 86% higher for those built between 2000-2009 than those built between 2010-2019.
- On the other hand, the 2021 stock of units occupied in buildings with 5+ units was 3.3 million for units built in the 2000s versus 3.2 million for units built in the 2010s (4% higher), while the stock of units occupied in buildings with 20+ units was 1.5 million for those built in the 2000s and 1.9 million for units built in the 2010s.
- Additionally, 7% of 1-4-unit homes were built in 2010-2019 versus 14% of 5+ unit homes, 52% of 1-4-unit homes were built in 1970-2009 versus 57% for 5+, and 41% if 1–4-unit homes were built pre-1970 versus 29% for 5+.
These data highlight the lack of new construction over the past decade. Coupled with the disruptions from the pandemic and strong housing demand from the millennial cohort, the U.S. housing market is structurally low on supply, as evidenced by extremely low vacancy rates of units for rent or for sale. Even though the current spike in mortgage rates has sharply decreased demand, we expect this chronic lack of inventory will be a factor in housing markets for some time.
–Edward Seiler eseiler@mba.org