MBA Chart of Week June 3, 2022: MBA Purchase Applications Payment Index
In March, MBA released its inaugural monthly Purchase Applications Payment Index (PAPI) – an affordability index that measures how new fixed-rate 30-year purchase mortgage payments vary across time relative to income. The third PAPI release on May 26 – based on April MBA Weekly Applications Survey data – gives us a picture of how affordability has been affected by increasing interest rates and elevated loan application amounts in the first third of 2022.
The national PAPI (based on median mortgage payment and median income) increased from 123.4 in December 2021 to 162.7 in April – an increase of almost 32% (even after we take increasing earnings into account). Indeed, the national median mortgage payment applied for by applicants was $1,889 in April, up from $1,736 in March, $1,653 in February, $1,526 in January, and $1,383 in December 2021. In other words, estimated median payments increased by 37% from December to April.
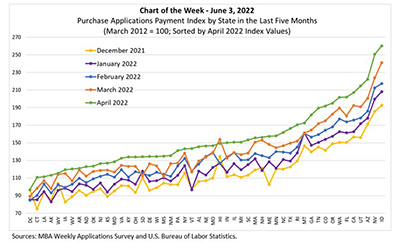
In this week’s MBA Chart of the Week, we use state level WAS data and show how the PAPI has evolved over the last five months in each state.
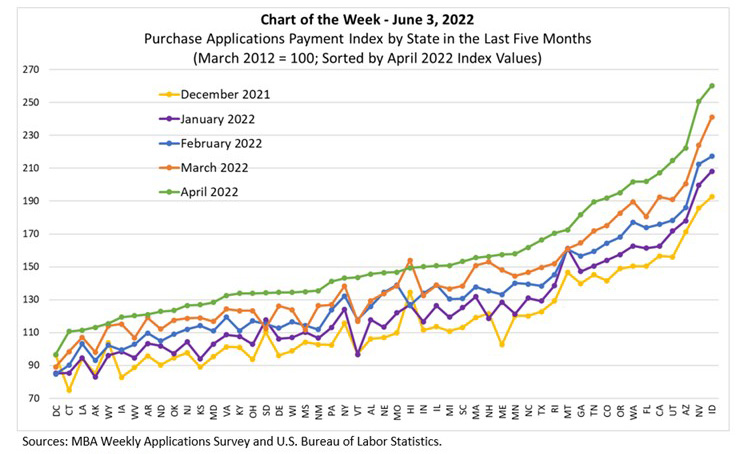
States with the highest PAPI in April (shown in green) were Idaho (260.2), Nevada (250.7), Arizona (222.3), California (214.7) and Utah (207.1). Both Idaho and Nevada PAPI values increased by over 35% in the first four months of 2022, while Utah’s increased by almost 38%. Indeed, every state’s PAPI increased in the first four months of the year (although DC’s by less than 1% as median application loan amounts were $84,500 lower in April than December, reflecting the distinctive nature of the DC market). That is, the sharp increases in interest rates for 30-year fixed-rate mortgage applications (by almost 2 percentage points) together with larger median loan application amounts (of 8.5%) have translated (among other factors) into lower affordability in all states in the first four months of 2022.
The WAS data for May indicates that monthly increases in the PAPI may show moderation in the next release. For example, the WAS data for the week ending May 27 shows that the average contract interest rate for 30-year fixed-rate mortgages was down 3 bps from four weeks earlier, and while the number of purchase applications was down 10.0% from four weeks earlier, the dollar volume was down 13.0%.
Edward Seiler eseiler@mba.org; Joel Kan jkan@mba.org.