May Mortgage Application Payments Rise to $1,897
Homebuyer affordability was largely unchanged in May, with the national median payment applied for by applicants up slightly to $1,897 from $1,889 in April, according to the Mortgage Bankers Association’s monthly Purchase Applications Payment Index.
“The ongoing affordability hit of higher home prices and fast-rising mortgage rates led to a slowdown in purchase applications in May,” said Edward Seiler, MBA Associate Vice President of Housing Economics and Executive Director of the Research Institute for Housing America. “While the median principal and interest payment only increased $8 from April, a typical borrower is paying $514 more through the first five months of 2022 – a jump of 37.1%,. Inflationary pressures and rates above 5 percent are both headwinds for the housing market in the coming months. MBA’s new forecast anticipates that sales of new and existing homes will fall below 2021 levels.”
The PAPI measures how new monthly mortgage payments vary across time – relative to income – using
data from MBA’s Weekly Applications Survey. An increase in the PAPI – indicative of declining borrower affordability conditions – means the mortgage payment to income ratio is higher due to increasing application loan amounts, rising mortgage rates or a decrease in earnings. A decrease in the PAPI – indicative of improving borrower affordability conditions – occurs when loan application amounts decrease, mortgage rates decrease, or earnings increase.
The national PAPI increased 0.4 percent to 163.4 in May from 162.8 in April, meaning payments on new mortgages take up a larger share of a typical person’s income. Compared to May 2021 (120.6), the index jumped 35.5 percent. For borrowers applying for lower-payment mortgages (the 25th percentile), the national mortgage payment increased 0.36 percent to $1,241 from $1,236 in April.
Additional Key Findings of MBA’s Purchase Applications Payment Index for May:
• The national median mortgage payment was $1,897 in May, up from $1,889 in April and $1,736 in March. Payments have increased $513 (37.1%) in the first five months of the year.
• The national median mortgage payment for FHA loan applicants was $1,430 in May, up from $1,374 in April and $1,005 in May 2021.
• The national median mortgage payment for conventional loan applicants was $1,960, down from $1,967 in April but up from $1,394 in May 2021.
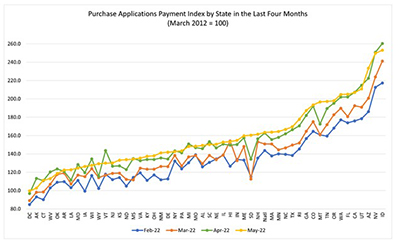
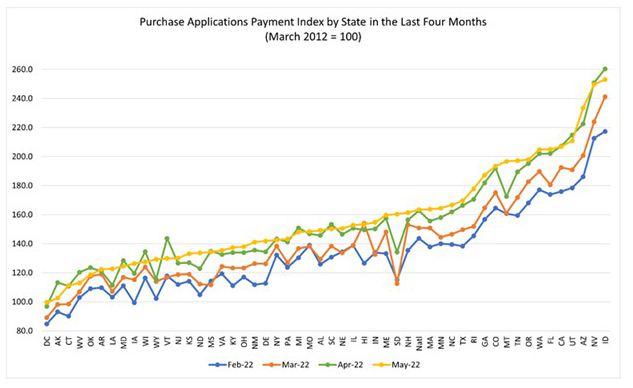
• States with the highest PAPI were Idaho (253.0), Nevada (249.7), Arizona (233.5), Utah (210.9) and California (206.9).
• States with the lowest PAPI were: Washington, D.C. (99.7), Alaska (102.6), Connecticut (111.2), West Virginia (113.0) and Oklahoma (118.5).
• Homebuyer affordability decreased slightly for Black households, with the national PAPI increasing from 165.9 in April to 166.6 in May.
• Homebuyer affordability decreased slightly for Hispanic households, with the national PAPI increasing from 155.8 in April to 156.4 in May.
• Homebuyer affordability decreased slightly for White households, with the national PAPI increasing from 163.6 in April to 164.3 in May.
About MBA’s Purchase Applications Payment Index
The Mortgage Bankers Association’s Purchase Applications Payment Index measures how new mortgage payments vary across time relative to income. Higher index values indicate that the mortgage payment to income ratio is higher than in a month where the index is lower. Contrary to other affordability indexes that make multiple assumptions about mortgage underwriting criteria to estimate mortgage payment level, PAPI directly uses MBA’s Weekly Applications Survey data to calculate mortgage payments.
PAPI uses usual weekly earnings data from the U.S. Bureau of Labor Statistics’ Current Population Survey. Usual weekly earnings represent full-time wage and salary earnings before taxes and other deductions and include any overtime pay, commissions, or tips usually received. Note that data are not seasonally adjusted.
The rent data series calculated for MBA’s national mortgage payment to rent ratio comes from the U.S. Census Bureau’s Housing Vacancies and Homeownership survey’s median asking rent. The HVS data is quarterly, and as such, the mortgage payment to rent ratio will be updated quarterly. Note: MPPR data is not included in this May release.
For additional information on MBA’s Purchase Applications Payment Index, click RES_SF_PAPIFAQ (mba.org).