2021 Sets Home Price Records; 2022—Maybe Not So Much
Red Bell Real Estate LLC, Wayne, Pa., reported multiple housing market records for 2021, including average sales price, days on market, median estimated home price and number of closed sales. But analysts cautioned signs of slowing could put a damper on 2022 results.
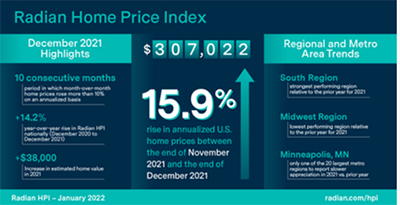
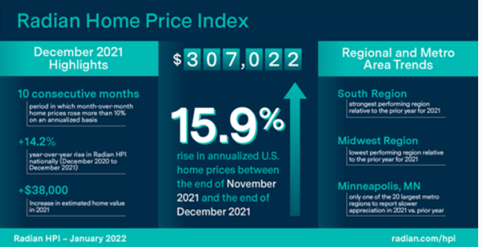
The Red Bell/Radian Home Price Index reported home prices rose nationally at nearly 16 percent annually through December, marking the 10th consecutive month of annual increases of more than 10 percent. For the full year, the Radian HPI rose 14.2 percent. In 2021, the 12-month rate of appreciation nationally was nearly double the rate of 8.0 percent set in 2020.
The report noted unlike 2020, which was marked by a slow first half and a robust second half, price appreciation strengthened steadily over the course of 2021. During the first six months of 2021, annualized appreciation rose by 10.6 percent, the strongest Radian had recorded to date. The last six months of 2021 were even stronger; annualized appreciation was 16.9 percent.
The report said for the calendar year, national real estate records were broken in several important categories: average sales price ($457,000); median estimated price ($307,000) days on market (75); number of closed sales (3.77 million) and average monthly listings (920,000)
“2021 was nothing short of spectacular for U.S. home values,” said Steve Gaenzler, SVP of Product, Data and Analytics. “The median owner saw an estimated increase of more than $38,000 in their home value, creating trillions of dollars in potential borrower equity. However, the market remains tough for many would-be buyers – competition is fierce, supply is low, entry-level options are more limited than ever before, and for the first time, more than one-quarter of homes sold cost $500,000 or more.”
The report noted in December, homes that sold for prices greater than $500,000 represented 28 percent of all sales; just two years earlier, those homes accounted for only 16 percent. Contrast that to lower priced homes (those selling below $250,000), which accounted for 18 percent of all sales two years ago but represented only 11 percent of all sales nationally in December. Gaenzler said mobility of more affluent borrowers has pushed performance on this segment relative to those homeowners more adversely impacted economically by the pandemic.
The report said nationally, 2021 recorded both historic low average monthly listing counts (supply) and record high sales volume (demand), as homes moved very efficiently through the real estate process. In 2021, Radian HPI recorded more than 3.7 million closed transactions, the highest ever recorded and besting the record of 3.6 million set in 2020. Unfortunately for buyers, the supply of homes has collapsed at the same time record sales are being recorded. In fact, in December 2021, the number of actively listed homes for sale was at the lowest level ever recorded (since the Radian HPI began tracking in 2007). At only 708,000 active listings, December’s inventory was more than -15 percent below the next lowest December (2020, 845k) and a whopping 40 percent below the average of the winter months (Nov-Feb).
“One year ago, the housing supply shortage was dire. Since then, it has only gotten worse,” Gaenzler said. “The combination of limited supply and record-high demand has buoyed prices and shrunk the time it takes for homes to sell, but it has also made it a very difficult market for many potential buyers.”
All six regions had stronger home price appreciation in 2021 than in 2020. The South was the strongest performing region relative to the prior year notching a nearly doubling of the full year appreciation rates (16.9 percent vs.8.5 percent). The South’s 16.9 percent annual appreciation was also the highest absolute regional appreciation rate for 2021. The strongest performing region of 2020, the Midwest, became the worst performer relative to the prior year, recording a 12.1 percent home price appreciation rate, an increase of only 33 percent above the full year rate of 9.1 percent in 2020. On an absolute basis, the MidAtlantic region recorded the slowest annual appreciation rate amongst the regions at +11.3 percent.
Pace of home price appreciation differs by state, but all 50 states recorded positive home price appreciation in 2021. In fact, while December tends to be a seasonally slower month, 10 states, all in the South region, still managed to record annualized one-month appreciation rates greater than +20 percent (GA, NC, SC, FL, MS, MT, UT, VT, ME, AZ).
All the 20 largest metro areas of the U.S recorded positive price appreciation, and all but one recorded faster annual appreciation in 2021 relative to the prior year. Minneapolis was the only one of the 20 largest metros to record slower appreciation rates in 2021. For the remaining 19 metros where home prices rose faster in 2021 than 2020, they averaged 50 percent faster appreciation rates. On an absolute basis, annual appreciation across the top 20 finished the year at 9.8 percent. Three metro areas, Seattle, Phoenix and Tampa recorded price appreciation rates faster than the national average of +14.2. The remaining large metros recorded appreciation below the national average. The average median estimated home price in the 20 largest metros is higher by more than $37,092 over the last 12 months, slightly below the national average gain of $38,367.
However, S&P Global Ratings, New York, cautioned that even as 2021 proceeded under the cloud of COVID-19, this year, however, market consensus points to increases in the 30-year fixed mortgage rate and a decline in total mortgage originations.
Nevertheless, S&P said, a change in working arrangements–perhaps a permanent transition to a partial remote-work option–and strong demand for housing are expected to push prices to even higher levels, albeit at a more subdued pace than last year.
“Even with decreased price appreciation and higher mortgage rates, it’s hard to have a bearish view on the sector given the strong housing fundamentals, which, in our view, will continue to be reflected in securitization activity and the actions of the government-sponsored enterprises,” S&P said. “We believe borrower credit behavior should hold up in 2022. That said, some regional housing markets may be overheating, mainly due to population dynamics. Affordability concerns will depend on how much wage growth we experience in relation to the inflation that is now at levels not seen since the early 1980s.”