MBA: November Share of Mortgage Loans in Forbearance Flat
The Mortgage Bankers Association’s monthly Loan Monitoring Survey reported loans in forbearance remained flat at 0.70% as of November 30. MBA estimates 350,000 homeowners are in forbearance plans.
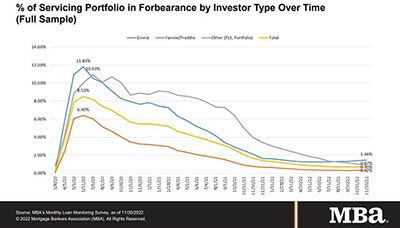
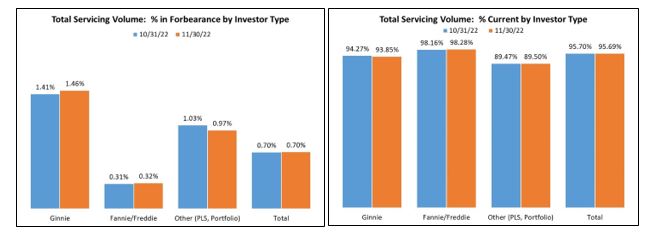
The share of Fannie Mae and Freddie Mac loans in forbearance increased by 1 basis point to 0.32%. Ginnie Mae loans in forbearance increased by 5 basis points to 1.46%, while the forbearance share for portfolio loans and private-label securities declined by 6 basis points to 0.97%.
“There were pockets of weakness in the November data, despite the forbearance rate remaining unchanged and the overall loan performance of serviced loans staying mostly flat,” said Marina Walsh, CMB, MBA Vice President of Industry Analysis. “The forbearance rate for Ginnie Mae loans increased for the fourth consecutive month, and the overall performance of the portfolio declined for the third consecutive month. Furthermore, the performance of government post-forbearance workouts also weakened.”
Walsh note with many indicators pointing to a recession and higher unemployment in 2023, “many of the most vulnerable homeowners will be those with FHA, VA, or other government loans. Loss mitigation options may help to ease the financial hardship for these homeowners.”
Key Findings of MBA’s Loan Monitoring Survey – November 1 – 30:
• Total loans in forbearance held at 0.70%.
• By investor type, the share of Ginnie Mae loans in forbearance increased from 1.41% to 1.46%.
• The share of Fannie Mae and Freddie Mac loans in forbearance increased from 0.31% to 0.32%.
• The share of other loans (e.g., portfolio and PLS loans) in forbearance decreased from 1.03% to 0.97%.
• Loans in forbearance as a share of servicing portfolio volume (#) as of November 30:
• Total: 0.70% (previous month: 0.70%)
• Independent Mortgage Banks: 0.95% (previous month: 0.96%)
• Depositories: 0.46% (previous month: 0.47%)
• By stage, 37.8% of total loans in forbearance are in the initial forbearance plan stage, while 50.1% are in a forbearance extension. The remaining 12.1% are forbearance re-entries, including re-entries with extensions.
• Of the cumulative forbearance exits for the period from June 1, 2020, through November 30, 2022, at the time of forbearance exit:
• 29.7% resulted in a loan deferral/partial claim.
• 18.2% represented borrowers who continued to make their monthly payments during their forbearance period.
• 17.3% represented borrowers who did not make all of their monthly payments and exited forbearance without a loss mitigation plan in place yet.
• 16.0% resulted in a loan modification or trial loan modification.
• 11.0% resulted in reinstatements, in which past-due amounts are paid back when exiting forbearance.
• 6.6% resulted in loans paid off through either a refinance or by selling the home.
• The remaining 1.2% resulted in repayment plans, short sales, deed-in-lieus or other reasons.
• Total loans serviced that were current (not delinquent or in foreclosure) as a percent of servicing portfolio volume (#) decreased slightly to 95.69% in November from 95.70% in October (on a non-seasonally adjusted basis).
• States with the highest share of loans that were current as a percent of servicing portfolio: Washington, Idaho, Colorado, Utah and Oregon.
• States with the lowest share of loans that were current as a percent of servicing portfolio: Mississippi, Louisiana, Indiana, New York and West Virginia.
• The share of loans that were current declined in 31 states compared to October.
• Total completed loan workouts from 2020 and onward (repayment plans, loan deferrals/partial claims, loan modifications) that were current as a percent of total completed workouts decreased to 76.89% in November from 78.16% in October.
MBA’s monthly Loan Monitoring Survey (replaced MBA’s Weekly Forbearance and Call Volume Survey in November 2021) represents 66% of the first-mortgage servicing market (32.9 million loans). To subscribe to the full report, go to www.mba.org/loanmonitoring.