Home Price Reports: Monthly Gains Turn Negative

Annual home price appreciation, which flew along at a 20-percent pace for much of the past several years, appears to be grinding to a much slower pace going into 2023.
Three monthly reports: the S&P CoreLogic Case-Shiller Home Price Index; the Federal Housing Finance Agency House Price Index; and the First American Real House Price Index—all reported sharply slowing monthly home price appreciation, with annual appreciation slowing to single-digits.
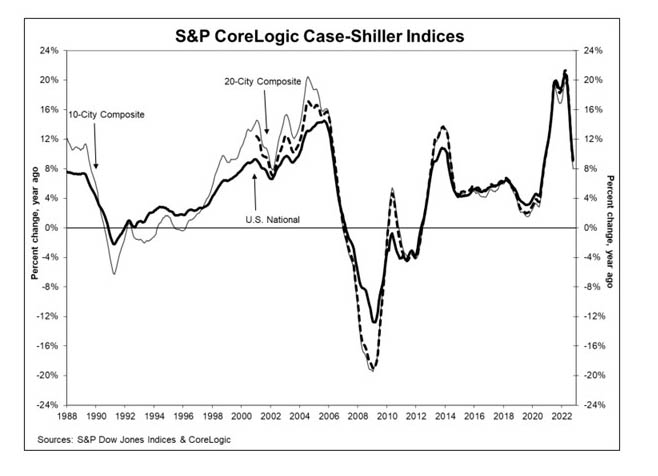
The S&P CoreLogic Case-Shiller U.S. National Home Price NSA Index reported a 9.2% annual gain in October, down from 10.7% in September. The 10-City Composite annual increase came in at 8.0%, down from 9.6% in the previous month. The 20-City Composite posted a 8.6% year-over-year gain, down from 10.4% in the previous month.
Miami led with a 21% year-over-year price increase, followed by Tampa at 20.5% and Charlotte at 15%. All 20 cities reported lower price increases in the year ending October 2022 versus the year ending September 2022.
Month over month, before seasonal adjustment, the U.S. National Index posted a -0.5% month-over-month decrease in October, while the 10-City and 20-City Composites posted decreases of -0.7% and -0.8%, respectively. After seasonal adjustment, the U.S. National Index posted a month-over-month decrease of -0.3%, and the 10-City and 20-City Composites posted decreases of -0.5%. All 20 cities reported declines before and after seasonal adjustments.
“October 2022 marked the fourth consecutive month of declining home prices in the U.S.,” said Craig J. Lazzara, Managing Director with S&P DJI. “As the Federal Reserve continues to move interest rates higher, mortgage financing continues to be a headwind for home prices. Given the continuing prospects for a challenging macroeconomic environment, prices may well continue to weaken.”
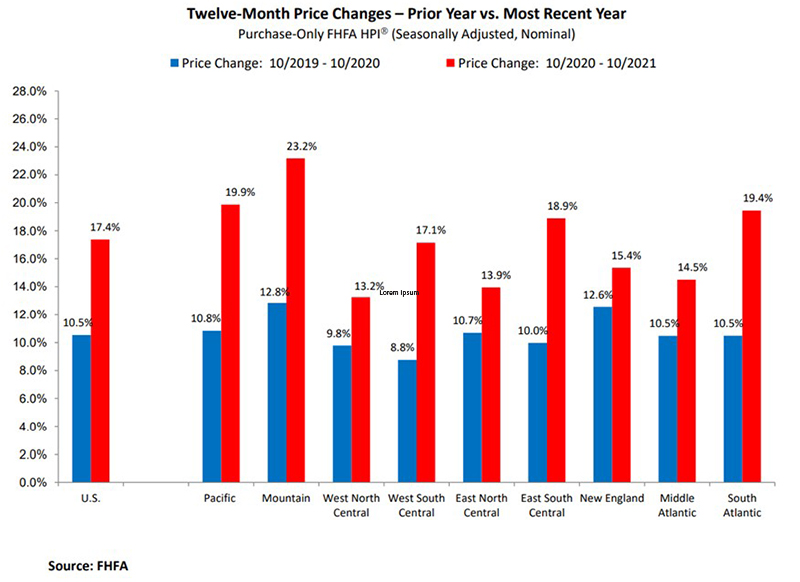
In a separate report, FHFA said house prices were flat nationwide in October, unchanged from September. The House Price Index said house prices rose 9.8 percent from October 2021 to October 2022. The previously reported 0.1 percent price increase in September 2022 remained unchanged.
For the nine census divisions, seasonally adjusted monthly house price changes from September to October 2022 ranged from -0.9 percent in the Pacific division to +1.4 percent in the New England division. The 12-month changes were all positive, ranging from +4.5 percent in the Pacific division to +14.1 percent in the South Atlantic division.
“U.S. house prices have seen two consecutive months of near-zero appreciation,” said Nataliya Polkovnichenko, Supervisory Economist in FHFA’s Division of Research and Statistics. “Higher mortgage rates continued to put downward pressure on demand, weakening house price growth. The U.S. house price index growth decelerated as it posted the first 12-month growth rate below 10 percent after 24 consecutive months of double-digit appreciation rates.”
Meanwhile, First American, Santa Ana, Calif., said its Real House Price Index showed real house prices increased by 8.7 percent between September and October and by 68.1 percent between October 2021 and October 2022.
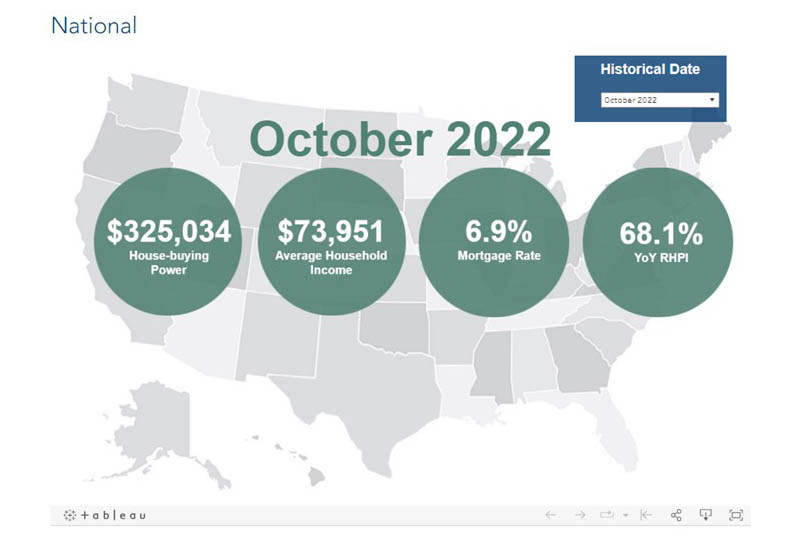
The report said consumer house-buying power, how much one can buy based on changes in income and interest rates, decreased 7.5 percent between September and October, and decreased 33.3 percent year over year. Real house prices are 49.5 percent more expensive than in January 2000. Unadjusted house prices are now 55.6 percent above the housing boom peak in 2006, while real, house-buying power-adjusted house prices are 5.5 percent above their 2006 housing boom peak.
“Affordability continued to suffer in October 2022,” said First American Chief Economist Mark Fleming. “This rapid annual decline in affordability was driven by a 12 percent annual increase in nominal house prices and a 3.8 percentage point increase in the average 30-year, fixed mortgage rate compared with one year ago. Even though household income increased 3.4 percent since October 2021 and contributed positively to consumer house-buying power, it was not enough to offset the affordability loss from the dramatic surge in mortgage rates and fast-rising nominal prices.
Fleming noted as affordability wanes and prompts buyers to pull back from the market, nominal house price appreciation has slowed. “Nationally, annual nominal house price growth peaked in March at nearly 21 percent but has since decelerated by more than 8 percentage points to 12 percent in October,” he said. “Looking ahead to 2023, an average of industry forecasts indicates that mortgage rates are expected to end next year at approximately 6 percent, as inflation is expected to recede, which may provide a modest boost to consumer house-buying power at the end of 2023 compared with this year.”
The report said states with the greatest year-over-year increase in the RHPI were Florida (+86.3), Georgia (+74.4 percent), Alabama (+72.6 percent), New Hampshire (+72.1 percent) and Alaska (+71.9 percent). No states saw a year-over-year decrease in the RHPI.
Among metros tracked by First American, markets with the greatest year-over-year increase in the RHPI were Miami (+92.8 percent), Tampa, Fla. (+81.4 percent), Indianapolis (+79.4 percent), Jacksonville, Fla. (+77.1 percent) and Nashville, Tenn. (+75.9 percent). No markets saw a year-over-year decrease in the RHPI.