Home Price Index Reports Record-High 19.7% Annual Gain
Annual home price growth of 20 percent—once considered as unrealistic as, say, the Cleveland Browns winning a Super Bowl—is suddenly, like the Browns, a very distinct possibility.
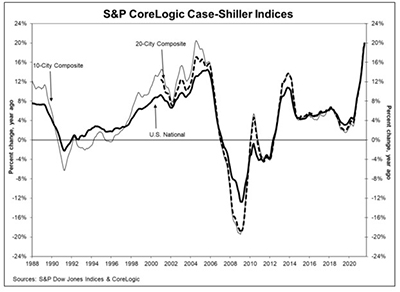
The monthly S&P CoreLogic Case-Shiller Indices reported annual home price gains nationwide of 19.7 percent in July, the fourth consecutive record gain.
In a separate report, the Federal Housing Finance Agency said house prices rose by 1.4 percent nationwide in July and by 19.2 percent annually.
The Case-Shiller 10-City Composite annual increase came in at 19.1%, up from 18.5% in June. The 20-City Composite posted a 19.9% year-over-year gain, up from 19.1% in June.
Phoenix led the 20-City Composite with a 32.4% year-over-year price increase, followed by San Diego at 27.8% and Seattle at 25.5% increase. Seventeen of the 20 cities reported higher price increases in the year ending July from June.
Month over month, the U.S. National Index posted an 1.6% increase in July, while the 10-City and 20-City Composites both posted increases of 1.3% and 1.5%, respectively.
After seasonal adjustment, the U.S. National Index posted a month-over-month increase of 1.5%, while the 10-City and 20-City Composites posted increases of 1.4% and 1.5%, respectively. All 20 cities reported increases before and after seasonal adjustments.
“The last several months have been extraordinary not only in the level of price gains, but in the consistency of gains across the country , said Craig J. Lazzara, Managing Director and Global Head of Index Investment Strategy with S&P DJI. “July’s 19.7% price gain for the National Composite is the highest reading in more than 30 years of S&P CoreLogic Case-Shiller data.”
Lazzara said strength in the U.S. housing market is being driven in part by a reaction to the COVID pandemic, as potential buyers move from urban apartments to suburban homes. “July’s data are consistent with this hypothesis,” he said. “This demand surge may simply represent an acceleration of purchases that would have occurred anyway over the next several years. Alternatively, there may have been a secular change in locational preferences, leading to a permanent shift in the demand curve for housing.”
“There’s a surge of millennials approaching the prime home-buying age and are experiencing more flexibility to expand their search locations,” said Selma Hepp, Deputy Chief Economist with CoreLogic, Irvine, Calif. “Additionally, there are move-up buyers with larger budgets who are relocating to more affordable areas where they’re financially able to outbid local residents. Taken together, these factors have created a double-whammy for home price growth.”
Hepp noted homebuyers across all ages continue to enjoy historically low mortgage rates, but have now also been joined by an influx of investor buyers over the summer. “This continued high buyer demand has even outstripped the improvements in the supply of for-sale homes from the all-time lows experienced in the spring,” she said. “While late summer indicators suggest some buyer fatigue, home price growth is likely to remain in double digits through the remainder of 2021.”
In a separate report, the Federal Housing Finance Agency said house prices rose by 1.4 percent nationwide in July and by 19.2 percent annually.
For the nine census divisions, seasonally adjusted monthly house price changes from June 2021 to July 2021 ranged from +0.8 percent in the West North Central division to +1.9 percent in the South Atlantic division. The 12-month changes ranged from +15.6 percent in the West North Central division to +25.6 percent in the Mountain division.
“Record appreciation rates for the U.S. continued in July,” said Lynn Fisher, FHFA Deputy Director of the Division of Research and Statistics. “Although the monthly pace of increase slowed in most Census Divisions in July, four areas experienced year over year growth rates in excess of 20 percent and all saw annual gains in excess of 15 percent.”