Home Flipping Up, But Profits at 10-Year Low
ATTOM, Irvine, Calif., issued its second-quarter U.S. Home Flipping Report, showing an increase in flipping activity during the quarter but a drop in profit margins.
The report showed 79,733 single-family homes and condominiums in the United States flipped in the second quarter, representing 4.9 percent of all home sales, or one in 20 transactions – the first increase in more than a year. This was up from 3.5 percent, or one in every 29 home sales in the nation, during the first quarter. But it was still down from 6.8 percent, or one in 15 sales, a year go and remained below levels seen throughout most of the past decade.
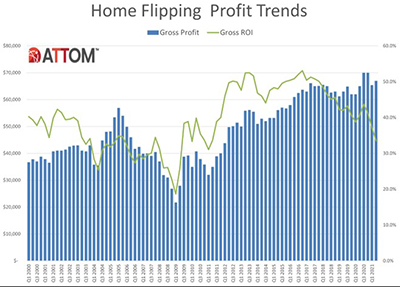
The report also said profit margins dipped to a 10-year low. The gross profit on the typical home flip nationwide (the difference between the median sales price and the median paid by investors) rose in the second quarter of 2021 to $67,000. That figure was up 2.4 percent from $65,400 in the first quarter, and 3.1 percent from $65,000 a year ago.
But the report said a more important measure of profit margins slid downward, with the typical gross-flipping profit of $67,000 in the second quarter translating into just a 33.5 percent return on investment compared to the original acquisition price. The national gross-flipping ROI was down from 37.2 percent in the first quarter and from 40.6 percent a year earlier, to its lowest point since the first quarter, when the housing market had yet to start recovering from a price slump brought on by the Great Recession in the late 2000s.
The decrease of 7.1 percentage points in the typical profit margins from a year ago marked the largest annual drop since mid-2014. Profit margins declined in the second quarter as prices on flipped homes rose more slowly than they did when investors originally bought their properties.
The median price of homes flipped in the second quarter soared to a record-high of $267,000, up 10.6 percent from $241,400 in the first quarter and 18.7 percent from $225,000 a year earlier. The annual increase marked the biggest price spike for flipped properties since 2005, and the quarterly gain topped all improvements since at least 2000.
But ATTOM Chief Product Officer Todd Teta said those price run-ups still failed to surpass increases that investors were absorbing – 13.6 percent quarterly and 25 percent annually – when they bought the homes that they sold in the second quarter. That gap – prices rising more on purchase than resale – led to profit margins dropping.
“Home flipping rebounded during the second quarter. But profits sure didn’t, as the typical home flip around the country netted the smallest return on investment in a decade,” Teta said. “However, it’s not like home flipping has become a losing proposition. A 33 percent profit on a short-term investment remained pretty decent, even after renovation and holding expenses. But with a few more periods like the second quarter of this year, investors may need to reframe how they look at these deals.”
Other report findings:
–Home flips as a portion of all home sales increased in 144 of the 182 metropolitan statistical areas analyzed in the report (79 percent). While the national rate remained below where it was throughout most of the past decade, it commonly rose up to 3 percentage points around the U.S.
–Among those metro areas, largest flipping rates during the second quarter were in Savannah, Ga. (9.5 percent of all home sales); Fort Wayne, Ind. (9.3 percent); Canton, Ohio (9 percent); Ogden, Utah (8.9 percent) and Indianapolis (8.9 percent).
–Profit margins dipped from the first quarter in 112 of the 182 metro areas with enough data to analyze (62 percent).
Metro areas with the largest returns on investment during the second quarter on typical home flips were Oklahoma City, OK (ROI of 196.4 percent); Fargo, ND (185.7 percent); Pittsburgh, PA (154.2 percent); Omaha, NE (135 percent) and York, PA (115.1 percent).
–The highest raw profits on median-priced home flips in the second quarter, measured in dollars, were again concentrated in the West, Northeast and South. Among metro areas with enough data to analyze, 22 of the top 25 were in those regions, led by San Jose, Calif. ($242,500); Fargo, N.D. ($200,336); San Francisco ($182,000); Salisbury, Md. ($159,500) and Barnstable, Mass. ($155,500).
–Home flippers who sold properties in the second quarter took an average of 147 days to complete the transactions, the lowest level since third quarter 2010. The latest number was down from an average of 156 in the first quarter and 183 a year ago.
–Only 7.8 percent were sold to buyers using loans backed by the Federal Housing Administration, down from 9.5 percent in the prior quarter and from 14.7 percent a year ago. That latest figure marked the lowest amount since the fourth quarter of 2007.
–Home flips accounted for more than 10 percent of all home sales in just 58 of the 1,071 counties around the U.S. with at least 10 home flips in the second quarter.