As Prices Soar, Home Affordability Declines for Average Workers
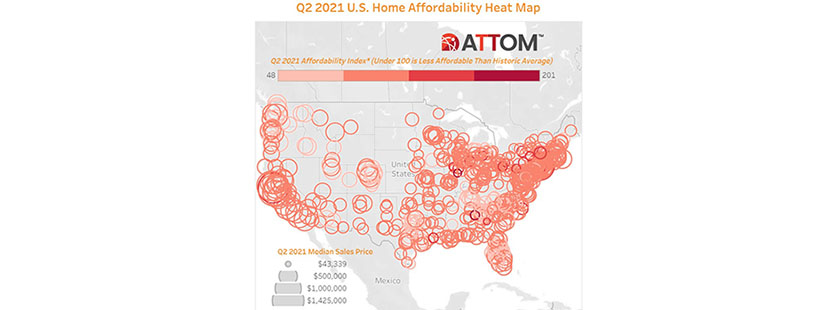
ATTOM, Irvine, Calif., reported median home prices of single-family homes and condos in the second quarter were less affordable than historical averages in 61 percent of counties across the nation in the second quarter, up from 48 percent in the first quarter, to the highest level in two years.
The company’s second-quarter 2021 U.S. Home Affordability Report said home prices have increased faster than wages in much of the country. Compared to historical levels, median home prices in 347 of the 569 counties analyzed in the second quarter are less affordable than past averages. That is up from 275 counties a year ago—a backslide that developed amid a 22 percent spike in the median national home price over the same period last year to a record of $305,000.
The report said while major ownership costs on median-priced homes do remain within the financial means of average workers across the nation in the second quarter, the percentage of counties where affordability is worse than historical averages has hit its highest point since second quarter 2019. This latest pattern has resulted in major ownership costs on the typical home consuming 25.2 percent of the average national wage of $63,986 in the second quarter, up from 22.7 percent in the first quarter and 22.2 percent a year ago, to the highest point since third quarter 2008.
Still, said Todd Teta, Chief Product Officer with ATTOM, the latest level is within the 28 percent standard lenders prefer for how much homeowners should spend on mortgage payments, home insurance and property taxes.
“Average workers across the country can still manage the major expenses of owning a home, based on lender standards, Teta said. “But things have gone in the wrong direction this quarter in a majority of markets as the national housing market boom roars onward. While super-low mortgage rates have certainly helped in a big way, prices have simply shot up too much to maintain historic affordability levels. The near future of affordability remains very uncertain, as it has throughout the pandemic.”
Other report findings:
–Major ownership costs on median-priced homes in the second quarter of 2021 consume less than 28 percent of average local wages in 327 of the 569 counties analyzed (57 percent).
–Median single-family home prices in the second quarter are up by at least 10 percent from a year ago in 348, or 61 percent, of the 569 counties.
–Home-price appreciation is greater than annualized wage growth in the second quarter in 409 of the 569 counties analyzed (72 percent), with the largest including Los Angeles County; Harris County (Houston); Maricopa County (Phoenix);; San Diego County; and Orange County, Calif.
–Average annualized wage growth is outpacing home-price appreciation in the second quarter in 160 of the 569 counties in the report (28 percent), including Cook County (Chicago); Kings County (Brooklyn); Bexar County (San Antonio); Santa Clara County (San Jose); and Wayne County (Detroit).
–The top 20 highest annual wages required to afford the typical home are all on the east or west coasts, led by San Mateo County, Calif. ($246,090); Marin County, Calif. ($245,914); San Francisco County ($237,588); New York County (Manhattan) ($212,246) and Santa Clara County, Calif. ($220,850).
— 347 counties (61 percent) are less affordable in the second quarter than their historic affordability averages, up from 48 percent of the same group of counties that were less affordable historically a year ago; 222 (39 percent) are more affordable than their historic affordability averages in the second quarter, down from 51 percent of the same group a year ago.