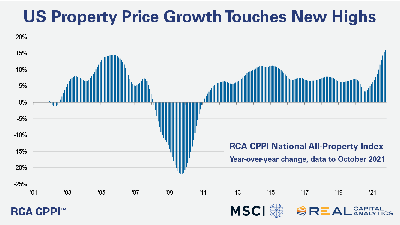
Commercial Property Price Growth Breaks Records as Demand Swells

U.S. commercial property price growth reached its fastest annual rate in years this fall amid intense investor demand for commercial real estate, Real Capital Analytics reported.
RCA said the firm’s national all-property price index rose 1.7 percent in October and 15.9 percent from a year ago. Investors acquired nearly $525 billion of commercial property assets for the year through October, a 70 percent increase from a year ago. Investors also spent more than $200 billion on apartment properties in the first 10 months of 2021–nearly double last year’s activity–and more than $100 billion on industrial properties.
Green Street, Newport Beach, Calif., said its price index of properties owned by real estate investment trusts is up 24 percent this year.
“Rent growth and occupancy are surprising to the upside and interest rates are incredibly low–the combination is having a strong effect on property prices,” said Peter Rothemund, Co-Head of Strategic Research at Green Street.
Rothemund said commercial property prices are nearly 15 percent higher than before COVID, “and in the best performing sectors, we’ve seen gains of two, three, even four times that amount,” he said. “The speed at which values are rising is unprecedented.”
The Green Street Commercial Property Price Index increased 5.3 percent in November alone. Industrial self-storage and retail properties registered the largest month-over-month gains.
CoStar Group, Washington, D.C., said price growth in secondary and tertiary markets exceeded those in large markets for the first time in several months. The firm’s value-weighted index, which tracks high-value trades common in core markets, edged 1.0 percent higher in October while its equal-weighted index of lower-priced property sales typically seen in secondary and tertiary markets advanced by a stronger 1.4 percent. The equal-weighted index increased 14.5 percent in the 12 months ending in October to a point higher than before COVID-19 pandemic.
CoStar noted other liquidity measures indicate the gap between buyers and sellers continues to narrow. The average number of days for-sale properties spend on the market fell to its lowest point since July 2020 and the sale-price-to-asking-price ratio narrowed by 2.3 percentage points to 94.6 percent, the tightest this ratio has been since 2006. “Meanwhile, the share of properties withdrawn from the market by discouraged sellers receded,” the report said.
