MBA Chart of the Week: Relative GDP Levels
The pace of economic growth, as measured by gross domestic product in the first quarter, picked up to a 6.4 percent annualized rate – the biggest first-quarter increase since 1984. We expect that pace to accelerate further over the next 6 months, as households unleash the pent-up demand for a range of goods and services.
Consumer spending increased at more than a 10 percent annualized rate in the first quarter, once again driven by strong increases in spending on durable and nondurable goods, but also with more recovery in service-sector spending.
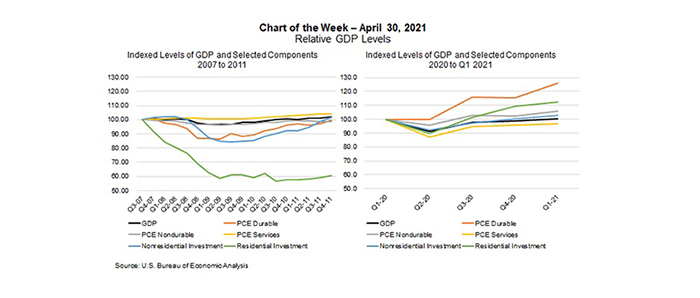
This week’s Chart of the Week is an update to one we did in October 2020, and compares the Great Recession (left), to the 2020 pandemic-driven recession (right), to illustrate how different this recovery is shaping up to be.
In the 2020 recession, we saw a 5 percent GDP decline in Q1 2020 and a 31 percent decline in Q2. The economy rebounded starting in last year’s third quarter (33 percent), followed by two more quarters of robust growth. If we compare the various GDP categories in terms of their levels relative to pre-pandemic levels, overall GDP broke even in the first quarter. Meanwhile, consumer spending on goods and business fixed investment are well more than where they were pre-pandemic. The only exception was in consumer spending on services, which as highlighted in the previous analysis, relies heavily on in-person activity, and remains 3 percent below its Q1 2020 level. The leisure and hospitality sector, which includes dining, travel, entertainment, and medical services, was hit particularly hard because pandemic-related restrictions and continues to lag in terms of growth. Many businesses in these sectors are still operating below full capacity.
Consumer spending on durable and nondurable goods remain strong (now 26 percent and 10 percent higher than in Q1 2020, respectively), supported by three stimulus packages and additional savings because of lower service- sector spending. Following the 2007-2009 recession, it took over 4 years for consumer spending to return to pre-recessionary levels.
Residential investment was 12 percent higher than it was pre-pandemic, driven by strong housing demand, home sales, and new residential construction. Housing construction is still sorely needed, given the still quite low level of housing inventory and steep home-price growth. However, housing was one of the bright spots in 2020, a stark contrast to 2007, when it took 13 years for residential investment to recover.
–Mike Fratantoni mfratantoni@mba.org; Joel Kan jkan@mba.org