MBA Chart of the Week: Existing Home Sales and Inventory
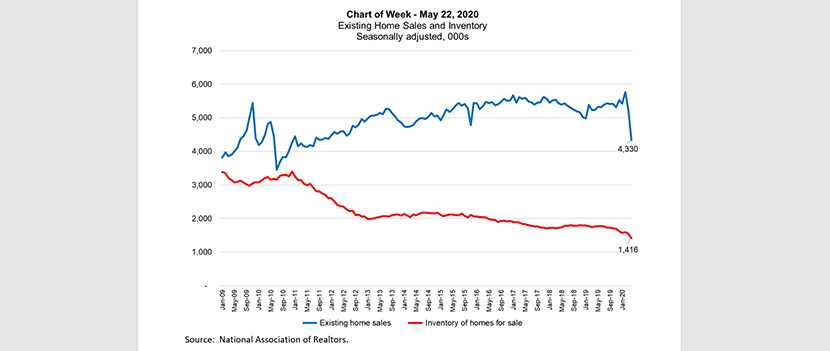
This week’s chart highlights recent trends in existing home sales and the inventory of homes for sale.
Existing home sales plunged in April, as much of the U.S. economy and housing market bore the brunt of the COVID-19 pandemic’s social distancing and closures. There was an 18 percent drop in the seasonally adjusted, annualized pace of home sales, the largest single month decline since July 2010. Additionally, the non-seasonally adjusted total was down 18 percent from a year ago – the largest decline since late 2010. After starting the year at an annualized sales pace of 5.5 million units, sales fell to a 4.3 million pace – the slowest pace of sales since 2011.
Existing inventory fell to a record-low 1.4 million units – a 20 percent drop. The drop in both measures was in part due to sellers pulling their listings off the market, and buyers delaying purchase decisions during these challenging economic times. As seen in the chart, housing inventory was already tight leading up to this, and the additional pullback will likely keep home price appreciation up – despite weaker sales activity.
Similar drops in new housing starts and permits further add to the severe shortage in housing supply. Our forecast is for home-price growth to remain in the 4 percent range, with pent-up demand pushing up prices and pulling down on supply.
Joel Kan jkan@mba.org