MBA Chart of the Week: MBA, Census Estimates of New Home Sales
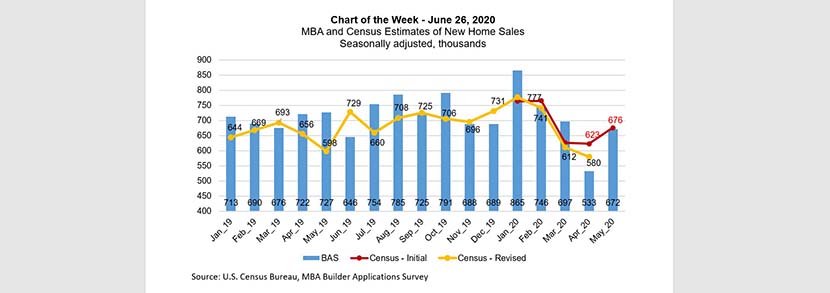
This week’s chart shows how the U.S. Census Bureau’s new home sales series has compared to our Builder Applications Survey data from 2019 through May 2020. The BAS has been a reliable leading indicator of Census’ new home sales data.
Last month, the BAS showed a 26 percent increase to 672,000 new home sales, and the Census release showed a 16 percent increase to 676,000 units. Additionally, the Census data for previous months tend to be revised closer to the BAS data in the months following their initial releases.
Using the BAS, which comprises mortgage affiliates of home builders, and thus tends to be more representative of the activity of larger home builders, MBA publishes trends on applications for new home purchases as well as estimates of new home sales. We estimate the survey covers over 30 percent of the new home sales market, and we typically release our results within the first two weeks of each month. As noted by Citi’s recent research note[i], the BAS “provides an early read on the New Home Sales estimates,” and the survey’s broader coverage makes it “a solid barometer of new home sales activity.”
MBA and Census’ May data showed robust increases following weak results in March and April, which were both severely impacted by the COVID-19-related economic weakness and spike in unemployment. The uncertainty and public health concerns caused some potential homeowners to delay their home purchases. More recently, some of these buyers seemed to have returned to the market. Even as the purchase market rebounds, there has yet to be a return to 2019 levels. Furthermore, there are signs pointing to difficulties for builders to ramp up their production, which may weigh on the new supply of homes in the coming months.
[i] Builders & Building Products: May New Home Sales +13% Y/Y; Another Significant Beat
Joel Kan jkan@mba.org; Anh Doan adoan@mba.org.