MBA Chart of the Week: Contribution to GDP Growth
(Source: Bureau of Economic Analysis.)
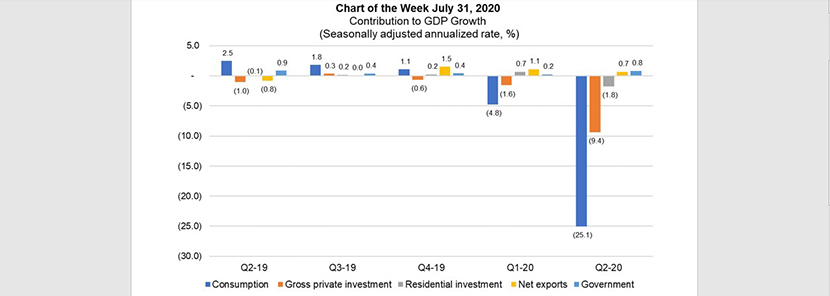
This week’s MBA Chart of the Week drills down on the U.S. Bureau of Economic Analysis’ advance estimate of real gross domestic product for the second quarter, which was released July 30.
The 32.9% decrease in the annual rate, while the worst contraction on record since the aftermath of World War II, was not surprising (it was even slightly better than MBA’s forecast of -34.6%) and reflects the pandemic-related shutdowns and government’s reaction—predominantly in the first half of the quarter.
The chart shows that personal consumption expenditures, which make up more than two-thirds of the overall economy, accounted for more than three-quarters of the real GDP contraction. More than 90% of the PCE reduction was due to the dramatic decline in services (-22.9% contribution to the -32.9% contraction), led by health care (-9.5%), and food services and accommodation (-5.6%). Housing services, including rent, owners’ imputed rent (an estimate of how much it would cost to rent owner-occupied units) and utility payments, contributed to a 0.6% increase in real GDP.
The decline in gross private domestic investment (-9.4%) reflected decreases in private inventories (-4.0%), nonresidential fixed investment (-3.6%), and residential investment (-1.8%). The reduction in residential investment (also shown as a separate category in the chart) primarily reflected a decrease in new single-family housing.
The last two components in the chart acted to offset some of the dollar drag to real GDP growth. The fall in exports contributed to a 9.4% decrease in GDP, but it was dominated by the fall in imports (10.1%). Since imports are a subtraction in the calculation of GDP, net exports contributed to a 0.7% increase. Finally, the increase in federal government spending led to a 0.8% increase in the contribution of government consumption expenditures and gross investment.
MBA’s economic forecast calls for the rest of the economy to recover in the second half of the year. However, this recovery is uncertain, and there are signals of possible pitfalls. For example, the BEA’s current-dollar change in GDP was lower than the real change (-34.3% vs. -32.9%), an indication of possible deflation.
–Joel Kan jkan@mba.org; Edward Seiler eseiler@mba.org.