MBA Chart of the Week: Home Sales and Inventory for Sale
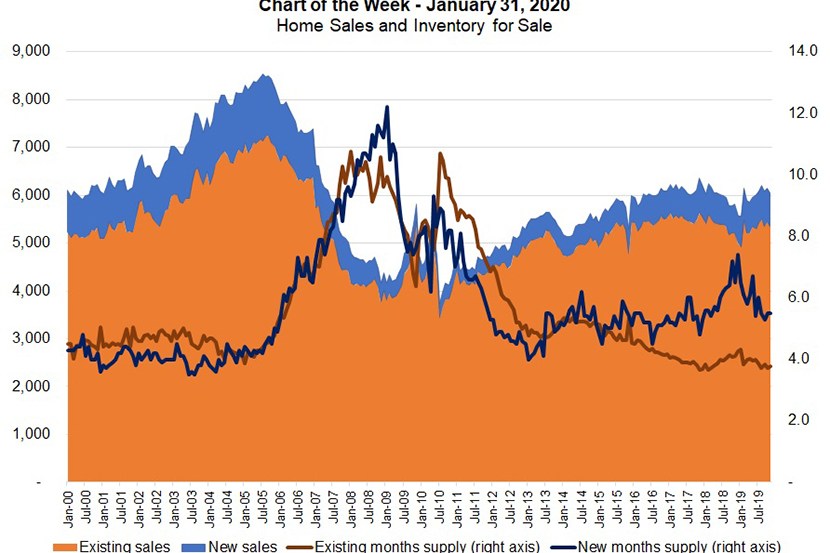
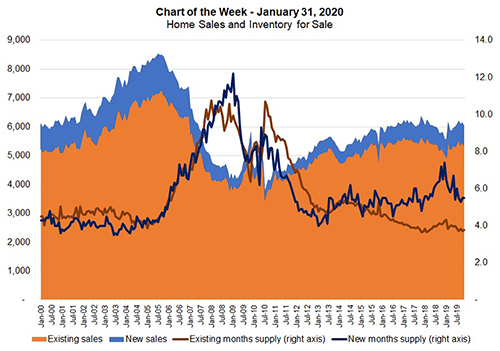
This week’s chart highlights longer-term trends in home sales and inventory of homes on the market.
Prior to the foreclosure crisis and recession from 2009-2010, the pace of total home sales was in the range of 6 million- to-8 million units, while the months’ supply of homes on the market was at around 4-to-5 months. Post-crisis and recession, home sales have picked back up to around 6 million units, but the existing-home inventory has continued to decline, despite the lackluster pace of sales. Inventory of new homes gradually moved higher, but has started to slow of late.
Home sales increased at the end of 2019 on both an unadjusted and seasonally adjusted basis. We expect that home sales will rise in 2020, as additional new housing construction comes onto the market, the job market remains strong, and mortgage rates stay low.
Typically, housing inventory drops at the end of the year. However, existing housing supply is now at a record low, and this will constrain spring home sales from being even higher. The recent uptick in homebuilding is a promising sign, as it increases what’s available for sale for prospective buyers and gives existing homeowners more options to move.
Overall, the housing market still faces a housing shortage. Builders continue to face challenges catering to where the demand is, especially in the entry level portion of the market and for smaller homes. Some progress has been made, but more is needed for supply to catch up with demand.
(Mike Fratantoni is chief economist and senior vice president of research and economics with the Mortgage Bankers Association. He can be reached at mfratantoni@mba.org. Joel Kan is associate vice president of economic and industry forecasting with MBA; he can be reached at jkan@mba.org.)