RIHA Study: Widening Inequality After Great Recession Attributed to Decline in Homeownership, Home Values
Distribution of wealth among U.S. households became increasingly unequal from 2007 through 2016 as a decline in homeownership and home values impacted the wealth of middle-class families, according to a new research report, The Distribution of Wealth Since the Great Recession, released yesterday by the Mortgage Bankers Association’s Research Institute for Housing America.
John C. Weicher, author of the report and Director for the Center for Housing and Financial Markets at the Hudson Institute, said the primary sources of wealth for most middle-class households are the assets in their retirement accounts and the equity in their homes. Bottoming out of home prices through 2012 and the 4.5% drop in the homeownership rate through 2015 both contributed to the decline in the median real household net worth, from $140,000 in 2007 to $97,000 in 2016 – 30% lower than before the financial crisis.

“The typical household by 2016 was wealthier than it was in 2013, but significantly poorer in comparison to its situation in 2007,” Weicher said. “These findings offer solid evidence as to why over half of Americans have consistently expressed in countless surveys that the country is not moving in the right direction. Middle-class households did not fully recover from the financial crisis, and the poor saw their net worth turn negative and stay negative.”
Meanwhile, the report noted, the rich recovered faster and their share of wealth increased from 71 percent in 2007 to 77 percent in 2016. The result, the study said: a less-equal America, with many families that fell behind having reasons to worry as they cope with the pandemic and move closer to retirement.
“Inequality may have improved in recent years because of the increase in home prices, the rising homeownership rate, the stock market’s steady ascent and recent policy changes that have reduced tax burdens and made it easier to save for retirement,” Weicher said. “Unfortunately, the pandemic has likely offset these changes – and especially for lower-income individuals working in jobs adversely impacted in the last nine months.”
The RIHA report used data from the Federal Reserve Board’s triennial Survey of Consumer Finances (SCF) to study distribution of household wealth, its main components and how the evolution of household wealth through the Great Recession – and its aftermath and subsequent recovery – affected poor, rich and middle-wealth households. The top 10% of households, by net wealth, are classified as rich, and the bottom 30% as poor.
Key Findings of The Distribution of Wealth Since the Great Recession:
- Distribution of wealth became increasingly unequal between 2007 and 2016, markedly more so than during the period of increasing total net worth that preceded it from 1992 to 2007.
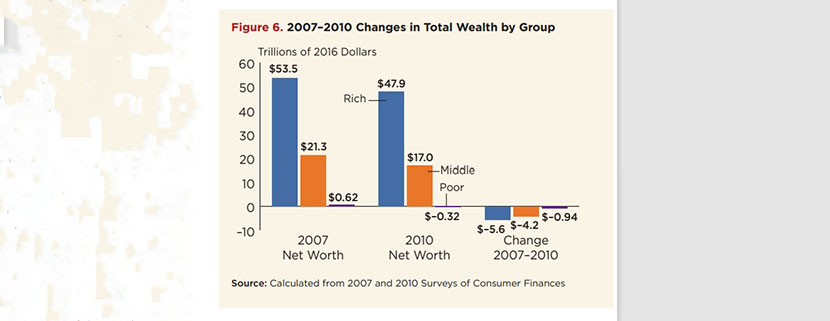
- The Great Recession affected the rich as well as the poor, but the rich were less affected. The total net worth of the rich declined by 11%, from $53.5 trillion in 2007 to $47.9 trillion in 2010. The net worth of the middle class declined by 20% and the debts of the poor increased by 60%, leaving them with negative net worth as a group.
- The wealth of the typical family dropped sharply from 2007 and, at least through 2016, did not recover.
- These changes are largely due to the sharp drop in homeownership: From 2007 to 2015, the homeownership rate fell by 4.5 percentage points—over 6 million families.
- Average real net worth was $45,000 more (7% higher) in 2016 compared to 2007; median real net worth was $43,000 less (30% lower).
- Various signs suggest that improvement occurred from 2016 to 2019 – notably the increase in home prices, the rising homeownership rate, and the rise in the stock market.
- Inequality
- The report uses two different ways to measure inequality: the Gini coefficient, which measures income across the entire distribution; and the concentration ratio, which measures income concentration at one end of the distribution.
- The Gini coefficient rose sharply, from 0.816 in 2007 to 0.846 in 2010, and then continued to rise to 0.849 in 2013 and to 0.860 in 2016.
- The richest 10% of households had 71.4% of the wealth in 2007 and 77.1% in 2016.
- From 2007 to 2010: The Downturn and the Slow Start toward Recovery
- From 2007 to 2010, total real wealth dropped by $10.5 trillion (14%) and completely offset the entire increase that had occurred between 2004 and 2007.
- There was a 40% decline in median wealth, from $140,000 in 2007 to $85,000 in 2010. The decline was partly the result of a decrease in the median home value, as well as a drop in the stock market.
- From 2010 to 2013: The Disappointingly Weak Recovery
- While the total net worth of Americans increased by $2.5 trillion (about 4%), from $64.3 trillion to $66.8 trillion (in 2016 dollars), both mean and median net worth declined – albeit slightly and much less than during the previous three years.
- Over 90% of the increase accrued to the rich; the small remainder accrued to middle-wealth households. The poor suffered a further diminution in their wealth; they had an additional $18 billion loss in 2013, a 5.6% increase to their $322 billion negative net worth in 2010.
- While the total net worth of Americans increased by $2.5 trillion (about 4%), from $64.3 trillion to $66.8 trillion (in 2016 dollars), both mean and median net worth declined – albeit slightly and much less than during the previous three years.
- From 2013 to 2016: The Rich Get Richer
- Total wealth increased very sharply, by $20 trillion, between 2013 and 2016. This 31% growth was the second largest during any three-year period between surveys (slightly less than the 34% between 1998 and 2001).
- A substantial share of the growth was the result of price increases for stocks and for homes.
- Of the $20 trillion total wealth increase between 2013 and 2016, the rich received $16.9 trillion (85%), middle-wealth households received $3.2 trillion (15%), and the poor were $100 billion closer to having their assets equal to their debts.
- As of the 2016 survey, the rich had $67.0 trillion in total net wealth, the middle-wealth households had $20.2 trillion, and the poor were still in the hole with net wealth equal to -$290 billion.
“Dr. Weicher’s study gives a comprehensive look at the wealth disparities and recovery patterns that rich, middle-class, and poor households experienced in the years after the Great Recession,” said Edward Seiler, RIHA Executive Director and MBA Associate Vice President of Housing Economics. “Fast-forward to 2020, and much of the financial distress caused by the pandemic is again being felt by those with less wealth. Although the homeownership rate is lower today, the good news is that those who do own have likely seen their wealth increase from the steady rise in home values in the past several years.”
Seiler cautioned if the pandemic lasts well into 2021 and millions continue to stay unemployed, “there’s real risk that inequality will increase.”
MBA’s RIHA is a 501(c)(3) trust fund. RIHA’s chief purpose is to encourage and assist – through grants to distinguished scholars and subject matter experts, educational institutions, research facilities, and government organizations – establishment of a broader-based knowledge of mortgage banking and real estate finance. You can find additional studies on the RIHA website: http://www.housingamerica.org.