MBA Chart of the Week: Vintage Year HELOC Utilization Rates

Source: MBA Home Equity Lending Report www.mba.org/heloc.
Home equity loan debt outstanding and borrower utilization rates declined in 2018, according to MBA’s newly released Home Equity Lending Study on lending and servicing of open-ended home equity lines of credit and closed-end home equity loans.
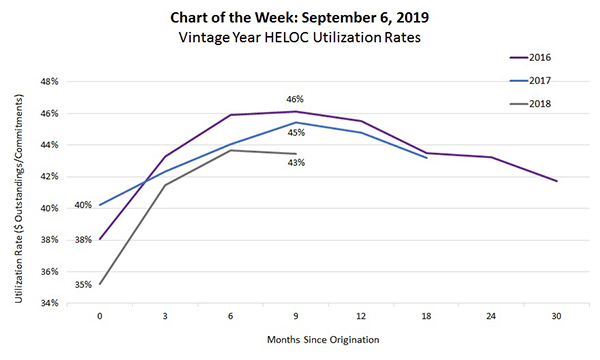
HELOC utilization rates represent the dollar volume of debt outstanding compared to the maximum committed credit facility in dollars offered by the lender. This week’s chart plots the average utilization rates over time (months since origination) for HELOCs originated in 2016, 2017 and 2018.
Month 0 is the average utilization at closing, Month 3 is utilization three months post-closing, Month 6 is utilization six months post-closing, and so on.
Utilization peaked between Months 6 and 9 in all three years, but generally dropped from the 2016-2018 vintage years. For example, average utilization nine months after origination was 46 percent for 2016, 45 percent for 2017 and 43 percent for 2018.
In 2018, for all active accounts irrespective of origination year, the average HELOC utilization was 46 percent. The percentage of HELOC accounts with no outstanding balance as of year-end 2018 was 27 percent.
(Marina Walsh is vice president of industry analysis with MBA; she can be reached at mwalsh@mba.org.)
