MBA Chart of the Week: Percent of Loans in Foreclosure
The third quarter results of MBA’s National Delinquency Survey, released last week (https://www.mba.org/news-research-and-resources/research-and-economics/single-family-research/national-delinquency-survey), showed improvements in delinquency and foreclosure measures.
The overall delinquency rate fell from last quarter to 3.97 percent, the lowest level since 1995. While delinquencies decreased across all loan types, they dropped most dramatically for FHA loans to 8.22 percent, down 100 basis points from last quarter and down 74 basis points from last year.
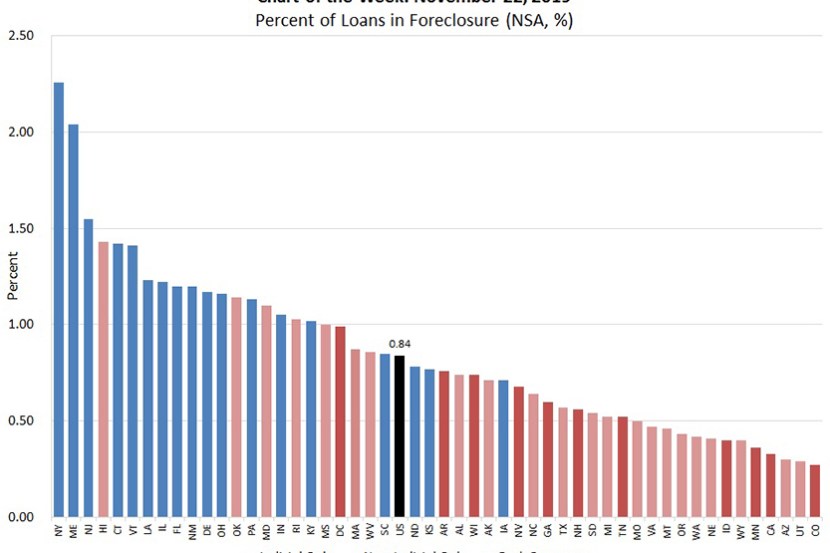
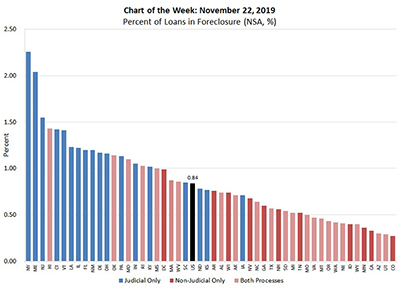
This week’s chart ranks the foreclosure inventory rate by state from highest to lowest, with markers for the foreclosure process of judicial, non-judicial or both processes. The overall foreclosure inventory rate fell from 0.90 percent in the second quarter to 0.84 percent in the third quarter, the lowest level since 1985. While the foreclosure inventory rate is at an historic low, the levels vary among states and it’s evident that for states with a lengthier judicial process, the foreclosure inventory rate is higher as it takes time to move the loans through the legal foreclosure process.
The labor market remains healthy and economic growth has been stronger than anticipated. Additionally, weather-related disruptions from the spring have waned. These two factors have contributed to the lowest level of overall delinquencies in nearly 25 years.
(Anh Doan is senior financial analyst with the Mortgage Bankers Association. She can be reached at adoan@mba.org.)