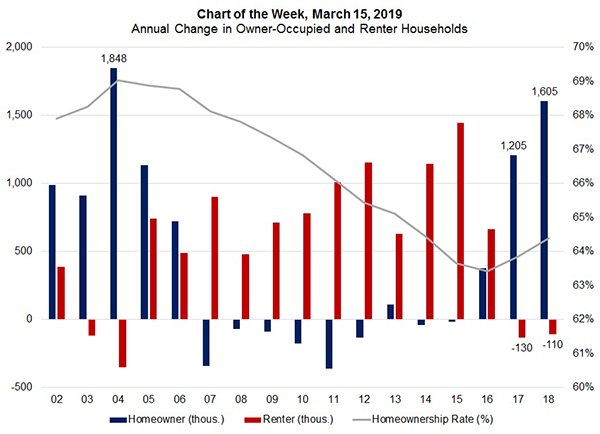
MBA Chart of the Week: Annual Change in Owner-Occupied, Renter Households

Source: U.S. Census Bureau.
This week’s Chart of the Week highlights U.S. Census Bureau data showing 1.6 million additional owner-occupied households in 2018–the largest annual increase since 2004. After nine years of mostly contraction in owner occupied households, 2018 was the third straight year of growth.
From 2007 to 2016, which covers the housing market downturn and Great Recession, as well as several years of a slow-growing economy, renter household growth exceeded owner-occupied household growth. This is one main reason why the homeownership rate declined, as foreclosures and short sales, the contracting economy, shifting housing preferences, and other economic factors pushed more households to rent.
Looking ahead, household formation will be driven largely by the millennial and baby boomer generations. Millennials continue to move into prime home ownership age, and baby boomers–with more now reaching retirement age–may start looking to sell their home for reasons such as downsizing or moving across state lines.
Recently, with home price growth moderating and mortgage rates declining from recent highs, affordability conditions have eased slightly. More importantly, wage growth has finally picked up, and the convergence of home-price and wage growth is a key development for increasing housing demand. We expect that these factors will outweigh any potential economic headwinds. For the next two years, MBA expects purchase origination volume to increase by 4 percent.
(Joel Kan is associate vice president of economic and industry forecasting with MBA; he can be reached at jkan@mba.org.)
