MBA Chart of the Week: FHFA Purchase-Only House Price Index

Source: Federal Housing Finance Agency.
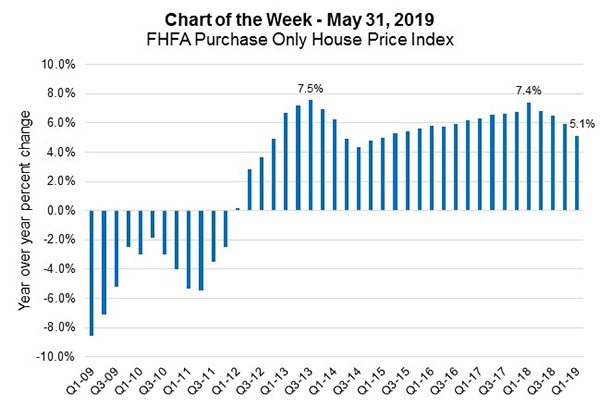
Purchase-only house prices in the U.S. were up 5.1 percent in the first quarter from the same quarter a year ago, a deceleration from 5.9 percent in the fourth quarter and significantly slower than the over 6 percent levels we saw between late 2016 and mid-2018.
Home-price appreciation was in the 6.2-to-7.4 percent range over that period. If we go back to the beginning of this data series, the average year-over-year price gain is 3.7 percent.
Growing demand, from an increasing number of owner occupied households and younger age cohorts approaching prime homeownership age, helped to push price growth higher, but so has a consistent shortage of inventory to meet this demand, both from new and existing homes. This is especially so for first-time home buyers in the lower price tier of the market, where home-price growth outpaces the gains seen in the higher price tiers.
Price appreciation patterns also differ by state and local markets. For example, higher price volatility states such as California and Colorado showed sharper slowdowns than the national aggregate, while other states such as Texas and Ohio experienced less of a deceleration.
This slowing in home-price growth is a positive development for the potential home buyers who have been unable to compete or afford to buy a home. Home sellers adjusting their price expectations, as well as an increased number of lower-priced homes being built, will continue to keep housing affordability in check. Combine these favorable market conditions with lower mortgage rates and increasing wage gains, and home sales and purchase originations should rise going forward.
(Joel Kan is associate vice president of economic and industry forecasting with MBA; he can be reached at jkan@mba.org.)
