MBA Chart of the Week: In-House Mortgage Servicer Productivity

Source: MBA Servicing Operations Study; www.mba.org/sosf.
The June 28 MBA Chart of the Week focused on productivity for retail mortgage originators. This week, we look at productivity for in-house mortgage servicers, based on data from MBA’s annual Servicing Operations Study.
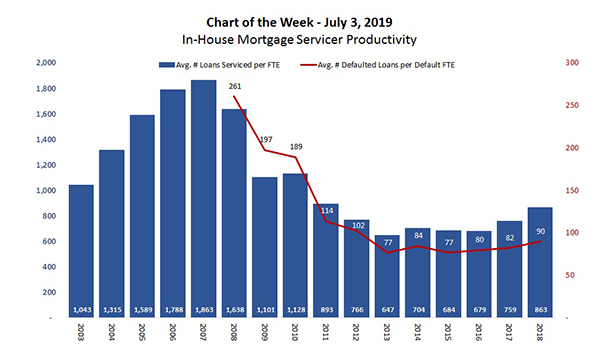
Servicer productivity–measured as the average loans serviced divided by the average servicing full-time-equivalent employee in a given year–peaked at 1,863 loans in 2007. Once the Great Recession hit, default rates rose and productivity dropped, reaching a study-low of 647 loans serviced per FTE in 2013. From 2013 to 2016, productivity stayed relatively flat and showed only modest improvement even as default rates dropped back to pre-recession levels. More substantial improvements were apparent in 2017 and 2018, when productivity rose to its highest level in seven years.
The trending in defaulted loans per default FTE show a similar pattern of declining productivity over a five-year period, followed by relatively flat results over the next several years. Improvement in default productivity was incremental but steady, reaching a six-year high of 90 defaulted loans per default FTE in 2018.
While servicer productivity is highly dependent on the level of defaulted loans (30+ day delinquencies and foreclosure inventory) at a given servicing shop, other factors come into play during this time period, including the adoption of national servicing standards, as well as revised state-by-state and agency rules on mortgage servicing.
For more information, contact Marina Walsh at mwalsh@mba.org.
