MBA Chart of the Week: Selected Wage Growth Measures

Source: Atlanta Fed; Bureau of Labor Statistics.
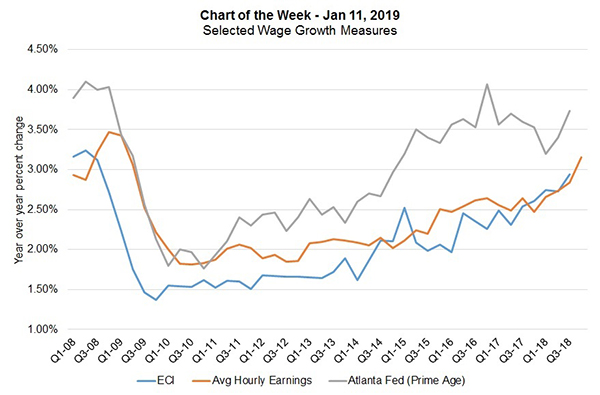
Our chart this week highlights three commonly tracked measures of wage growth: the employment cost index; average hour earnings; and the Atlanta Fed’s wage growth tracker.
The chart shows year-over-year percent changes for each series relative to the same quarter one year ago. All three measures point to wage growth that accelerated through most of 2018 and in some cases, at the fastest pace since the last recession.
The pickup in wage gains has been driven by monthly payroll growth that continues to barrel along. The average for 2018 was 220,000 jobs per month, which made it the strongest in three years. Also pushing up wages was the excess of job openings that forced more employers to boost pay in order to stay competitive to retain and attract the appropriate talent. Furthermore, the unemployment rate has stayed low, and at 3.9 percent, is still close to the lowest level in nearly 50 years.
Despite recent concerns surrounding the partial government shutdown, as well as financial market volatility, signs of a weaker global economy and the Fed’s anticipated policy actions for 2019, the job market remains remarkably strong and the U.S. economy has stayed on a course of solid growth. With unemployment still extremely low in most parts of the country, this upward trend in wage growth will continue to support consumer spending, which drives a significant share of economic growth.
Additionally, as mortgage rates have stopped their upward move for now and home-price growth has moderated, increasing wage growth will likely help to drive purchase activity in early 2019.
(Joel Kan is associate vice president of economic and industry forecasting with MBA; he can be reached at jkan@mba.org.)
