MBA Chart of the Week: Measures of New Home Sales

Source: Census Bureau, MBA.
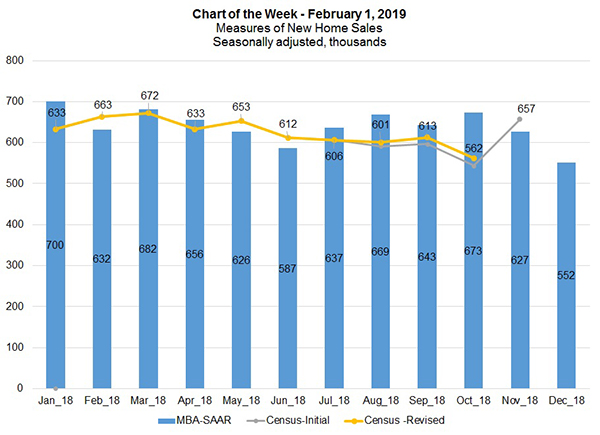
This week’s chart compares two different estimates of new home sales.
The MBA Builder Applications Survey tracks mortgage applications taken by lenders affiliated with, or who work in cooperation with, home builders on the purchase of new single family properties. Using these data, we can derive an estimate of new home sales, and our estimates show that the sales pace fell in December for the second consecutive month to a seasonally adjusted annual rate of 552,000 units. This is down 12 percent from the November estimate (627,000 units).
This week, the U.S. Census Bureau published its estimate of new home sales, which indicated a sales pace of 657,000 units for November–an increase of 17 percent over the month to the highest level in eight months. There were also upward revisions for the August, September and October estimates as well, indicating a stronger picture of the new home sales market. The November sales pace, however, was still 4 percent lower than November 2017. For the eighth straight month, Census data revealed another increase in new inventory for sale.
By our estimates, the retreat in new home purchase activity in December seemed to be intensified by a few factors, including recent stock market volatility, which was stoked by fears of a domestic and global economic downturn. However, as inventory grows and prices start to cool, we expect to see home buying activity pick up, supported by the solid economy and wage growth that is still gaining momentum.
