MBA Chart of the Week: Thanksgiving Prices Since 2000
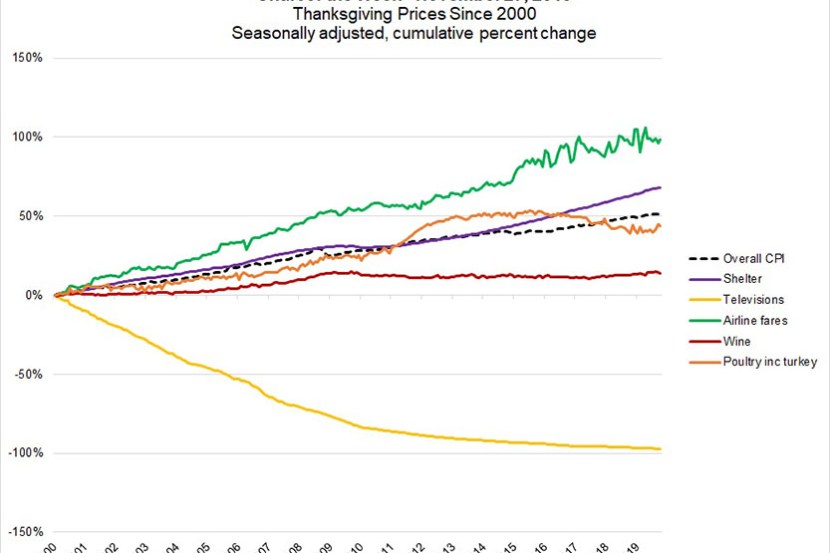
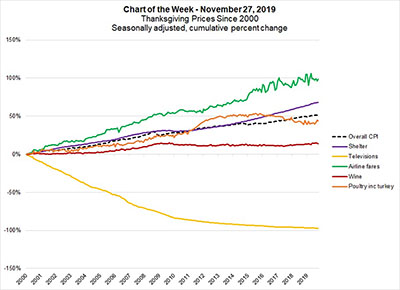
In the spirit of Thanksgiving, this week’s chart highlights prices of items that households commonly purchase this time of the year. This is based on data from the Consumer Price Index, a main measure of price inflation published by the U.S. Bureau of Labor Statistics. The chart shows the price changes as the cumulative percent change since the turn of the century.
Airline fares showed the largest price growth, having increased 98 percent over the 19-year period, while turkey prices have gone up 44 percent and wine 14 percent. Televisions, which seem to have become a Black Friday staple, have seen prices fall 97 percent over this time. For reference, the overall CPI has increased 52 percent since 2000.
The Federal Housing Finance Agency just released its Q3 2019 data on home-price growth, showing a 4.9 percent increase in home prices for purchase transactions, a slight deceleration from the 5.2 percent growth in Q2, and sixth consecutive monthly slowdown. The CPI measure of shelter prices, which includes both rental and homeowner costs for primary residences, have increased 68 percent.
Even though home-price growth shelter prices continue to outpace income growth, we have started to see that gap close slightly. This should hopefully help to ease housing affordability for renters and prospective homebuyers.
(Joel Kan is associate vice president of economic and industry forecasting with MBA; he can be reached at jkan@mba.org.)