MBA Chart of the Week: Cumulative Change in Home Prices Vs. Months’ Supply of Existing Homes

Sources: Bureau of Labor Statistics; Federal Housing Finance Agency; National Association of Realtors.
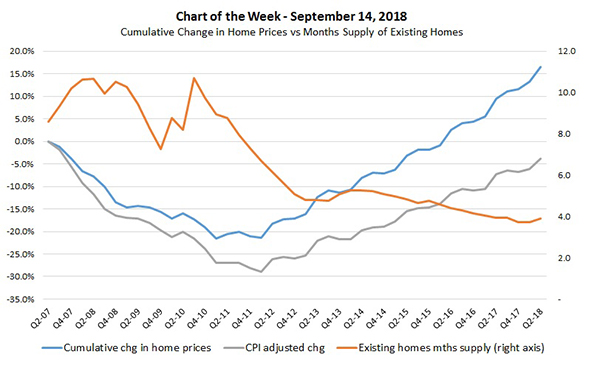
This week’s chart highlights the cumulative change in home prices relative to the series’ peak in second quarter 2007 using data from the Federal Housing Finance Agency.
As of the second quarter, aggregated home prices in the US were 16.7 percent higher than in second quarter 2007, after declining as low as 21.6 percent in early 2011. However, when adjusted for inflation using the Consumer Price Index, current home prices are still nearly 4 percent below second quarter 2007.
Also shown on the chart is the quarterly average for the National Association of Realtors’ months’ supply of existing homes for sale, a measure of inventory that accounts for both the pace of sales and the number of homes for sale on that market. Supply has gone from a peak of 10.7 months down to a low of 3.7 months at the end of 2017 and in early 2018. This short supply of homes has been a main driver of home price appreciation as limited inventory has caused buyers to bid prices up.
However, we are now starting to see signs of deceleration in home prices, as data for the second quarter show home prices increased at a rate of 6.5 percent over the year, compared to a 7.3 percent increase in the first quarter. While year-over-year growth appears strong, we are starting to see seasonally adjusted quarterly growth show some signs of slowing, as typically strong states such as Oregon and California had quarterly increases of 0.79 percent and 0.36 percent, respectively, compared to a national increase of 1.11 percent.
Even as inventory remains tight, we are starting to see affordability issues put a more significant damper on the higher end of the market, slowing some of the growth in home prices in traditionally high cost areas. Additionally, builders still face challenges such as labor and input costs, but as they start building lower priced, entry level focused units, the change in the mix will also serve to slow median home price growth (and not repeat sales indexes like the FHFA measure above).
(Joel Kan is associate vice president of economic and industry forecasting with MBA; he can be reached at jkan@mba.org.)
